
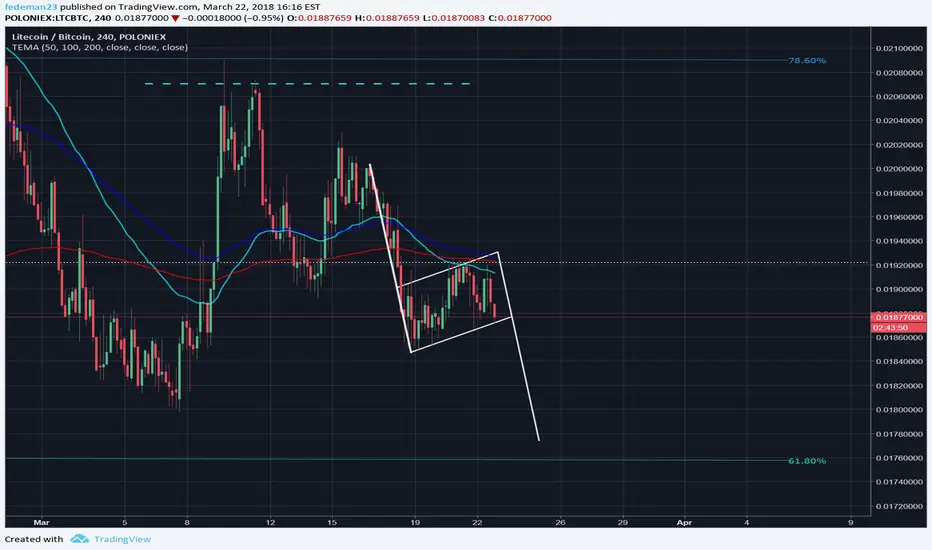
In the 4h chart it's clear a bearish flag, with LTC price that will probably touch the 100 EMA in the same zone of 61.8 Fibonacci retracement. Good coincidence, isn't it?
This is the overall picture.

If the 100 EMA does not work as a support line, expect Litecoin to touch the white drawn support line.
This is the overall picture.
If the 100 EMA does not work as a support line, expect Litecoin to touch the white drawn support line.
Not
PS: This is a short term analysisİşlem kapandı: hedefe ulaştı
Told you
Feragatname
Bilgiler ve yayınlar, TradingView tarafından sağlanan veya onaylanan finansal, yatırım, alım satım veya diğer türden tavsiye veya öneriler anlamına gelmez ve teşkil etmez. Kullanım Koşulları bölümünde daha fazlasını okuyun.
Feragatname
Bilgiler ve yayınlar, TradingView tarafından sağlanan veya onaylanan finansal, yatırım, alım satım veya diğer türden tavsiye veya öneriler anlamına gelmez ve teşkil etmez. Kullanım Koşulları bölümünde daha fazlasını okuyun.