
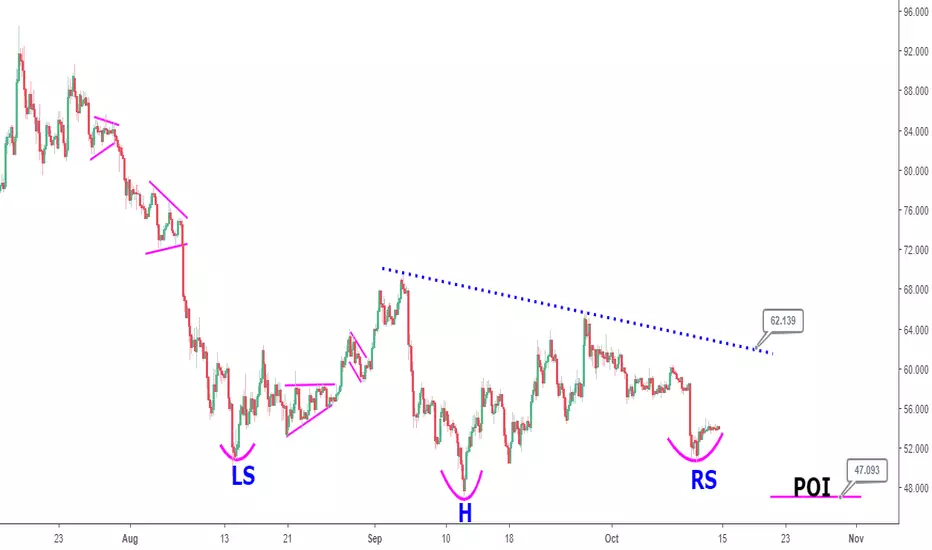
The 4 hour timeframe of Litecoin (LTCUSD) is captured in this analysis from July 24, 2018 to current date. In particular, August 14, 2018 to current date appears to be shaping up as an inverted head and shoulders pattern (or head and shoulders bottom).
The left shoulder (LS), right shoulder (RS) and possible Head (H) of the pattern are marked on the chart. A close above the downward sloping line at ~$62.14, taken as the neckline would confirm the pattern, whose implication is ideally bullish.
Price closing below ~$47.10 (point of invalidation = POI) before closing above $62.14 would invalidate the formation of the bullish pattern in Litecoin.
The left shoulder (LS), right shoulder (RS) and possible Head (H) of the pattern are marked on the chart. A close above the downward sloping line at ~$62.14, taken as the neckline would confirm the pattern, whose implication is ideally bullish.
Price closing below ~$47.10 (point of invalidation = POI) before closing above $62.14 would invalidate the formation of the bullish pattern in Litecoin.

İlgili yayınlar
Feragatname
Bilgiler ve yayınlar, TradingView tarafından sağlanan veya onaylanan finansal, yatırım, alım satım veya diğer türden tavsiye veya öneriler anlamına gelmez ve teşkil etmez. Kullanım Koşulları bölümünde daha fazlasını okuyun.
İlgili yayınlar
Feragatname
Bilgiler ve yayınlar, TradingView tarafından sağlanan veya onaylanan finansal, yatırım, alım satım veya diğer türden tavsiye veya öneriler anlamına gelmez ve teşkil etmez. Kullanım Koşulları bölümünde daha fazlasını okuyun.