
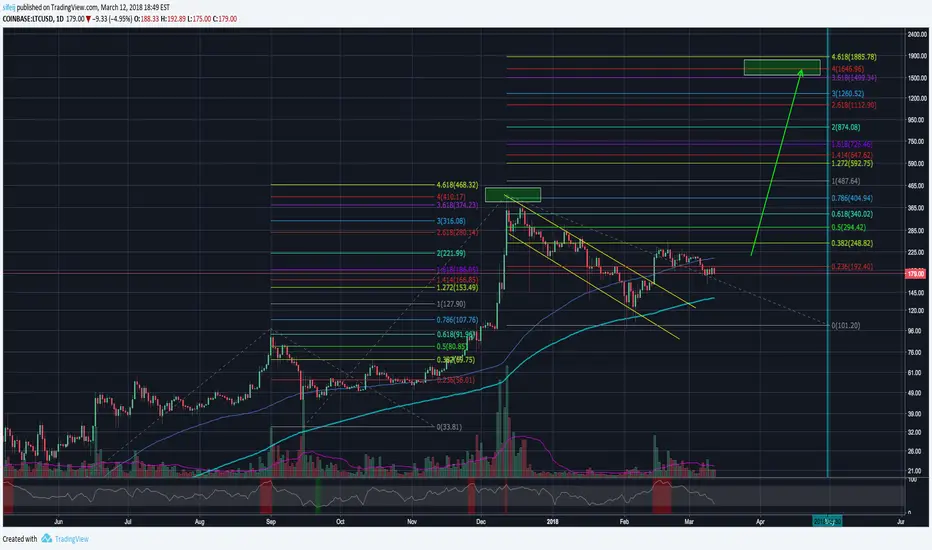
This is solely based on previous performance of LTCUSD pair, using Fibonacci projection.
Last time when the price hit 420, that was Fibonacci projection level of 4. If we use the same level, we will see $1646 Litecoin very soon.
Last time when the price hit 420, that was Fibonacci projection level of 4. If we use the same level, we will see $1646 Litecoin very soon.
Not
Here is my calculation based on past performance of LTC.LTCBTC last time lowest point was 0.005, then 5x to 0.025 in about 83 days, 50% drop to 0.013, if it does 5x again, next target is 0.065BTC.
LTCBTC last time lowest point was $36, then reached Fibonacci projection of 4.0 which is $420, if it does 4.0 again, next target is $1646.
$1646/0.065 = $25323 USD/BTC, and if we use 83 days to calculate from the lowest point to this target, it should be right around the end of May.
I don't know if I am making sense, but the math does not lie. All we rely on is let the history repeats itself. :)
Not
Sorry forgot to say how I got the 0.065. it is also assumed, it 5x from the lowest point -->0.013 * 5 = 0.065.
Not
it should be right around the end of April (before May)
Feragatname
Bilgiler ve yayınlar, TradingView tarafından sağlanan veya onaylanan finansal, yatırım, alım satım veya diğer türden tavsiye veya öneriler anlamına gelmez ve teşkil etmez. Kullanım Koşulları bölümünde daha fazlasını okuyun.
Feragatname
Bilgiler ve yayınlar, TradingView tarafından sağlanan veya onaylanan finansal, yatırım, alım satım veya diğer türden tavsiye veya öneriler anlamına gelmez ve teşkil etmez. Kullanım Koşulları bölümünde daha fazlasını okuyun.