
Litecoin (LTC) technical analysis:
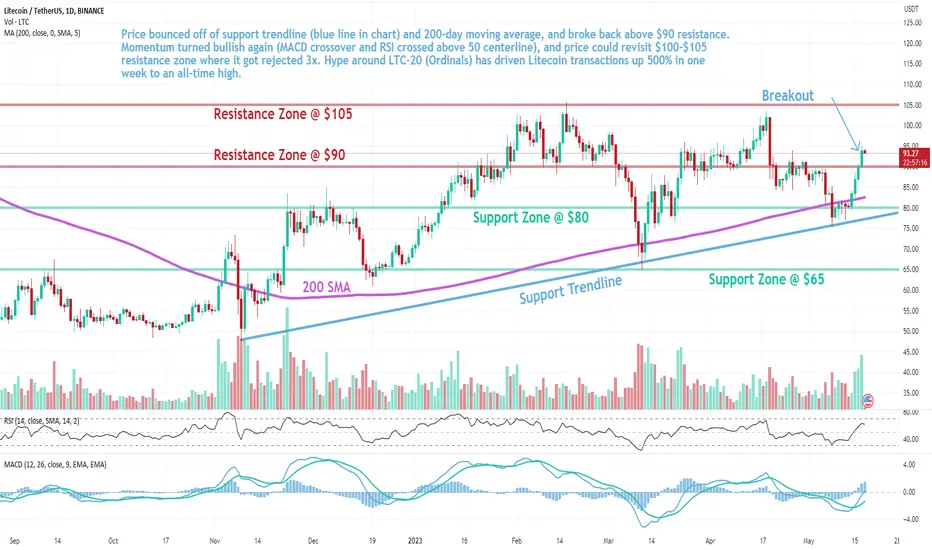
Trade setup: Price bounced off of support trendline (blue line in chart) and 200-day moving average, and broke back above $90 resistance. Momentum turned bullish again (MACD crossover and RSI crossed above 50 centerline), and price could revisit $100-$105 resistance zone where it got rejected 3x. Hype around LTC-20 (Ordinals) has driven Litecoin transactions up 500% in one week to an all-time high.
Trend: Uptrend on Short-Term basis, Downtrend on Medium-Term basis and Neutral on Long-Term basis.
Momentum is Bullish (MACD Line is above MACD Signal Line and RSI is above 55).
Support and Resistance: Nearest Support Zone is $80, then $65. The nearest Resistance Zone is $90, which it broke, then $105.

Feragatname
Bilgiler ve yayınlar, TradingView tarafından sağlanan veya onaylanan finansal, yatırım, alım satım veya diğer türden tavsiye veya öneriler anlamına gelmez ve teşkil etmez. Kullanım Koşulları bölümünde daha fazlasını okuyun.
Feragatname
Bilgiler ve yayınlar, TradingView tarafından sağlanan veya onaylanan finansal, yatırım, alım satım veya diğer türden tavsiye veya öneriler anlamına gelmez ve teşkil etmez. Kullanım Koşulları bölümünde daha fazlasını okuyun.