
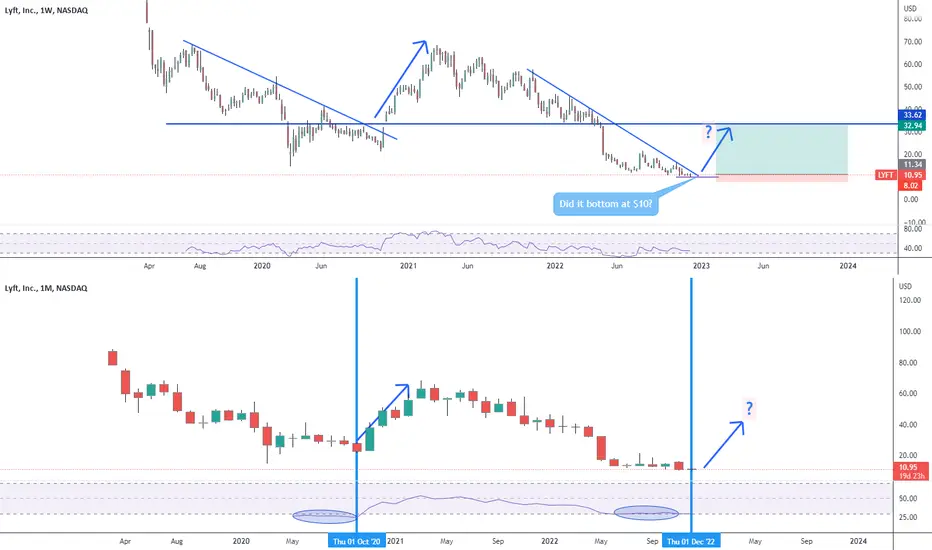
Top chart weekly, bottom chart monthly. See the pattern? The monthly timeframe shows the price has been trading in oversold territory for 5 months, last time that happened the price blew up. I'm opening a small long position on Monday if a see the price trying to break the resistance I'll add.
İşlem aktif
Just added. The $11.50 support level is holding wellİşlem aktif
Well, the $10 is holding well. Still holding my long position. Looks like bulls are coming back.
Feragatname
Bilgiler ve yayınlar, TradingView tarafından sağlanan veya onaylanan finansal, yatırım, alım satım veya diğer türden tavsiye veya öneriler anlamına gelmez ve teşkil etmez. Kullanım Koşulları bölümünde daha fazlasını okuyun.
Feragatname
Bilgiler ve yayınlar, TradingView tarafından sağlanan veya onaylanan finansal, yatırım, alım satım veya diğer türden tavsiye veya öneriler anlamına gelmez ve teşkil etmez. Kullanım Koşulları bölümünde daha fazlasını okuyun.