
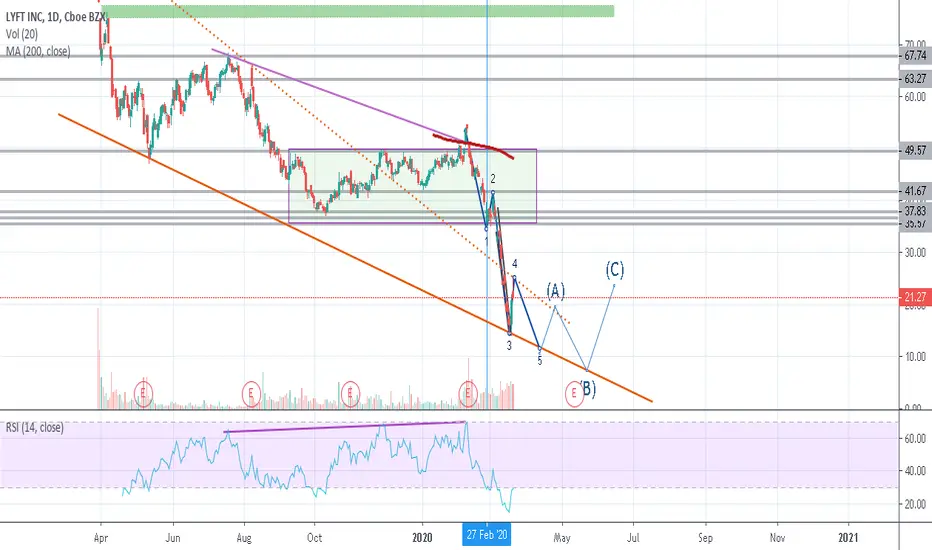
We can see in 1 day chart of Lyft stock the forming of an elliot wave in the downtrent direction and the possible areas of the ABC corrective pattern.
The downtrend was also confirmed by the hidden divergence we can see in the chart with purple lines.
The downtrend was also confirmed by the hidden divergence we can see in the chart with purple lines.

Feragatname
Bilgiler ve yayınlar, TradingView tarafından sağlanan veya onaylanan finansal, yatırım, alım satım veya diğer türden tavsiye veya öneriler anlamına gelmez ve teşkil etmez. Kullanım Koşulları bölümünde daha fazlasını okuyun.
Feragatname
Bilgiler ve yayınlar, TradingView tarafından sağlanan veya onaylanan finansal, yatırım, alım satım veya diğer türden tavsiye veya öneriler anlamına gelmez ve teşkil etmez. Kullanım Koşulları bölümünde daha fazlasını okuyun.