Satış
MATICUSD ❕ downtrend
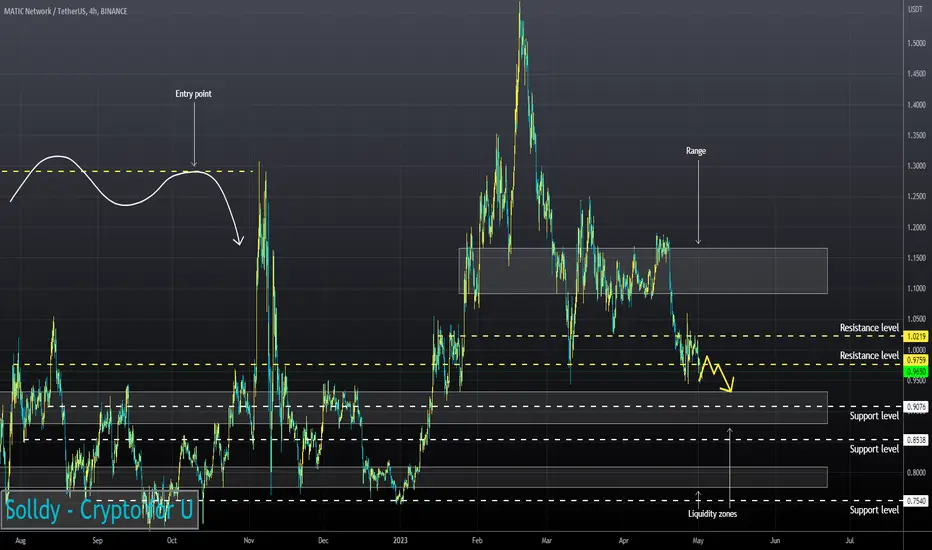
The movement of the RSI chart indicates that the asset continues its movement in a bearish trend and is now testing its upper limit (4H, 1H and 30m TFs)
I believe that the price of the asset will continue to decline if it fixes under the resistance level.
I believe that the price of the asset will continue to decline if it fixes under the resistance level.

Feragatname
Bilgiler ve yayınlar, TradingView tarafından sağlanan veya onaylanan finansal, yatırım, alım satım veya diğer türden tavsiye veya öneriler anlamına gelmez ve teşkil etmez. Kullanım Koşulları bölümünde daha fazlasını okuyun.
Feragatname
Bilgiler ve yayınlar, TradingView tarafından sağlanan veya onaylanan finansal, yatırım, alım satım veya diğer türden tavsiye veya öneriler anlamına gelmez ve teşkil etmez. Kullanım Koşulları bölümünde daha fazlasını okuyun.