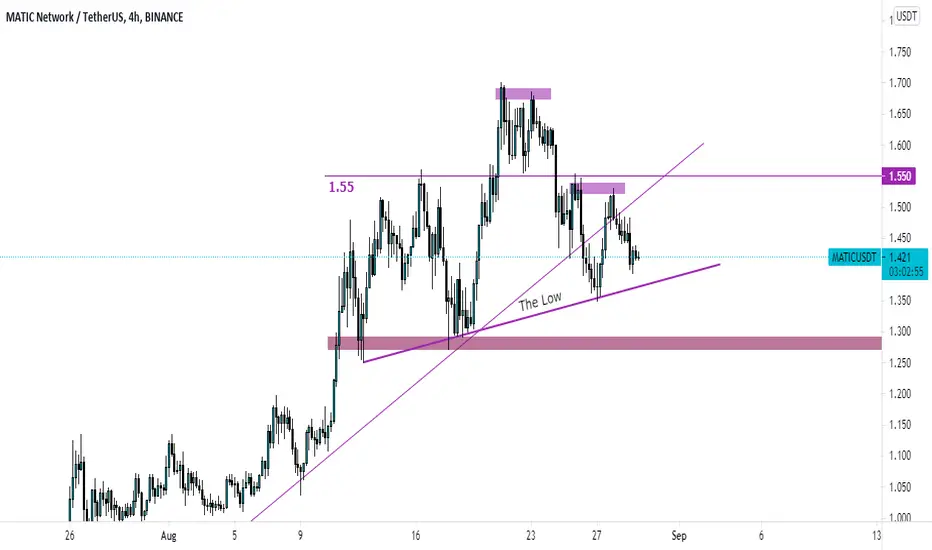
$MATIC forming Head & Shoulder pattern
After a slight rebound,
#MATIC reached its resistance zone facing the selling price.
The price seems to form an H&S (head and shoulders) pattern, which is bearish.
Well, until the price does not break below the low (marked in the chart), everything is fine.
Potentially, prices may also rebound from the small trend line.
#MATIC reached its resistance zone facing the selling price.
The price seems to form an H&S (head and shoulders) pattern, which is bearish.
Well, until the price does not break below the low (marked in the chart), everything is fine.
Potentially, prices may also rebound from the small trend line.

iSmashProfit
İlgili yayınlar
Feragatname
Bilgiler ve yayınlar, TradingView tarafından sağlanan veya onaylanan finansal, yatırım, alım satım veya diğer türden tavsiye veya öneriler anlamına gelmez ve teşkil etmez. Kullanım Koşulları bölümünde daha fazlasını okuyun.
iSmashProfit
İlgili yayınlar
Feragatname
Bilgiler ve yayınlar, TradingView tarafından sağlanan veya onaylanan finansal, yatırım, alım satım veya diğer türden tavsiye veya öneriler anlamına gelmez ve teşkil etmez. Kullanım Koşulları bölümünde daha fazlasını okuyun.