
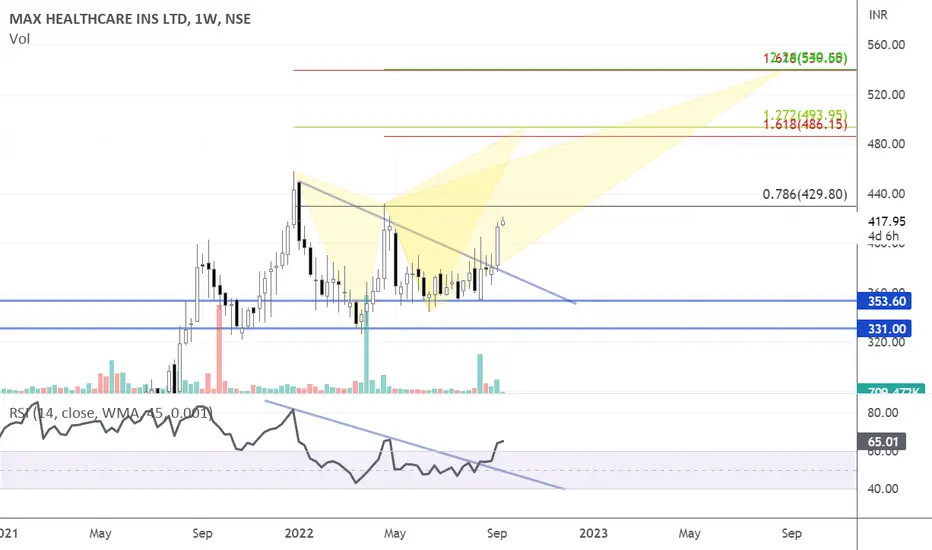
There is a trendline breakout on both Price and RSI on the weekly chart of Max Healthcare.
There is also a probability of Butterfly Pattern on the chart and if it unfolds stock can see 430, 490, and 540 levels in the coming months.
1. Type of Trade: Positional Long Trade
2. Buy on dips
3. Price Should sustain above 330 - 350 price zone.
There is also a probability of Butterfly Pattern on the chart and if it unfolds stock can see 430, 490, and 540 levels in the coming months.
1. Type of Trade: Positional Long Trade
2. Buy on dips
3. Price Should sustain above 330 - 350 price zone.

Feragatname
Bilgiler ve yayınlar, TradingView tarafından sağlanan veya onaylanan finansal, yatırım, alım satım veya diğer türden tavsiye veya öneriler anlamına gelmez ve teşkil etmez. Kullanım Koşulları bölümünde daha fazlasını okuyun.
Feragatname
Bilgiler ve yayınlar, TradingView tarafından sağlanan veya onaylanan finansal, yatırım, alım satım veya diğer türden tavsiye veya öneriler anlamına gelmez ve teşkil etmez. Kullanım Koşulları bölümünde daha fazlasını okuyun.