Alış
MCO BTC - Trade structure you might not want to miss
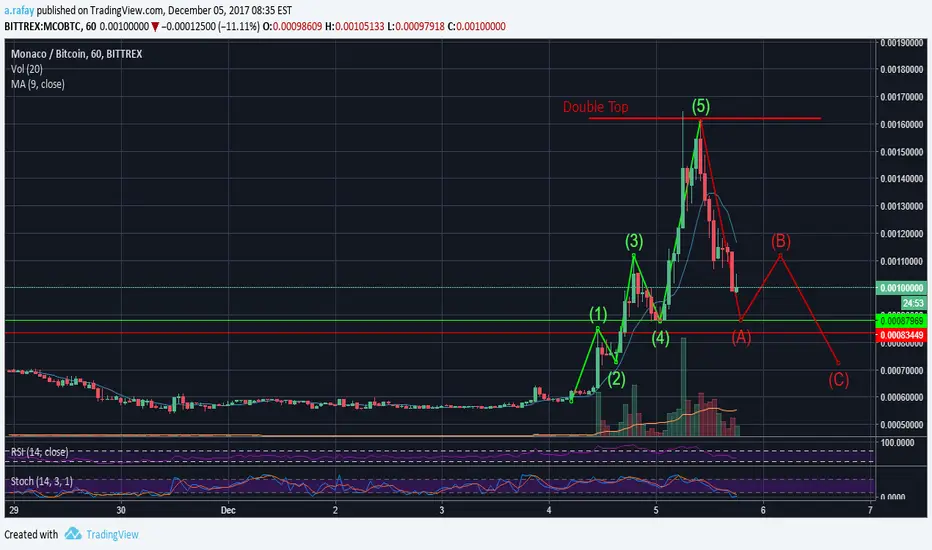
MCO BTC gave almost 150% in matter of 24 hours on 5 exchange listings and the launch of new debit card.
But, what goes up, always comes down!
On 1 hour chart, we see the following:
- Elliott wave formation
- ABC formation can take place
- previous support (green line)
Buy orders can be placed around 0.0009-0.00092 area with stop loss defined via red line on the chart. First target can simply be the (B) level mentioned on chart. If that is crossed, we are looking at 0.00160 again.
happy trading :)
But, what goes up, always comes down!
On 1 hour chart, we see the following:
- Elliott wave formation
- ABC formation can take place
- previous support (green line)
Buy orders can be placed around 0.0009-0.00092 area with stop loss defined via red line on the chart. First target can simply be the (B) level mentioned on chart. If that is crossed, we are looking at 0.00160 again.
happy trading :)
Not
This was a fun trade :D seldom happens that traders sees rewards this quickly :)Some profit booked and some position left open for the bigger target

Feragatname
Bilgiler ve yayınlar, TradingView tarafından sağlanan veya onaylanan finansal, yatırım, alım satım veya diğer türden tavsiye veya öneriler anlamına gelmez ve teşkil etmez. Kullanım Koşulları bölümünde daha fazlasını okuyun.
Feragatname
Bilgiler ve yayınlar, TradingView tarafından sağlanan veya onaylanan finansal, yatırım, alım satım veya diğer türden tavsiye veya öneriler anlamına gelmez ve teşkil etmez. Kullanım Koşulları bölümünde daha fazlasını okuyun.