
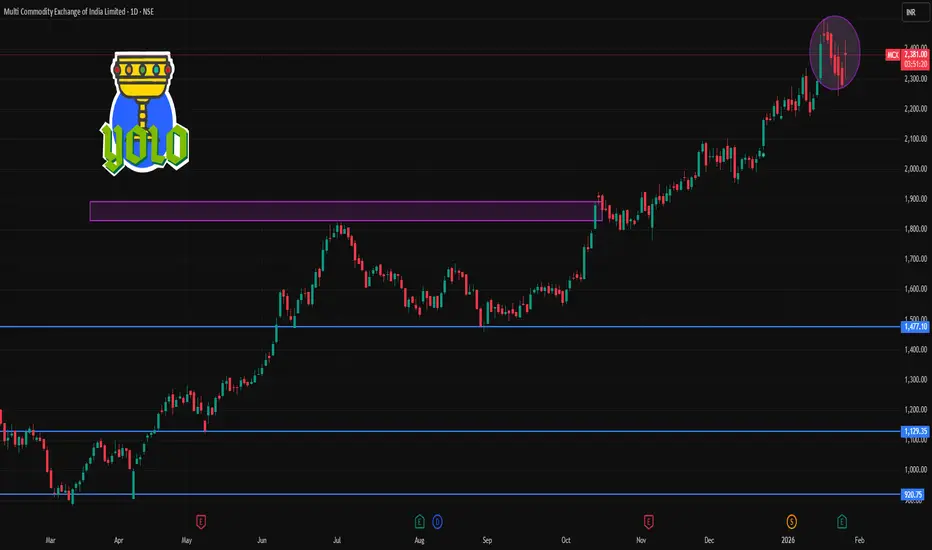
📌 MCX (Multi Commodity Exchange of India Ltd) — Daily Levels
(Based on latest technical snapshot ~21 Jan 2026)
🔹 Current Price (approx):
₹2,320 (as of latest update)
📈 Daily Pivot & Key Levels
Resistance
R1: ₹2,394 – Immediate resistance
R2: ₹2,469 – Next upside barrier
R3: ₹2,513 – Higher resistance zone
Support
S1: ₹2,275 – First support
S2: ₹2,231 – Medium support
S3: ₹2,156 – Stronger support on dips
📊 Moving Averages (Daily)
Bullish long‑term bias seen with higher moving averages:
20‑day SMA/EMA: ₹2,253 / ₹2,259
50‑day SMA/EMA: ₹2,098 / ₹2,115
100‑day SMA: ₹1,887
200‑day SMA: ₹1,667
Price trading above most medium/long MAs suggests an overall uptrend persists on the daily time frame.
🔎 Daily Technical Indicator Notes
RSI (~14): ~64 – Mild bullish momentum, not yet overbought.
MACD: Bullish trend continuation.
ADX: Strong trend strength indication.

Contact Knowledgehub for a detailed consultation: Dm on WhatsApp: [wa.link/a2o0kz]-
Phone No: [+91 93102 26243]-
Email: [tradingviewknowledgehub@gmail.com]---
-- Let’s achieve success together!
Phone No: [+91 93102 26243]-
Email: [tradingviewknowledgehub@gmail.com]---
-- Let’s achieve success together!
İlgili yayınlar
Feragatname
Bilgiler ve yayınlar, TradingView tarafından sağlanan veya onaylanan finansal, yatırım, alım satım veya diğer türden tavsiye veya öneriler anlamına gelmez ve teşkil etmez. Kullanım Koşulları bölümünde daha fazlasını okuyun.