
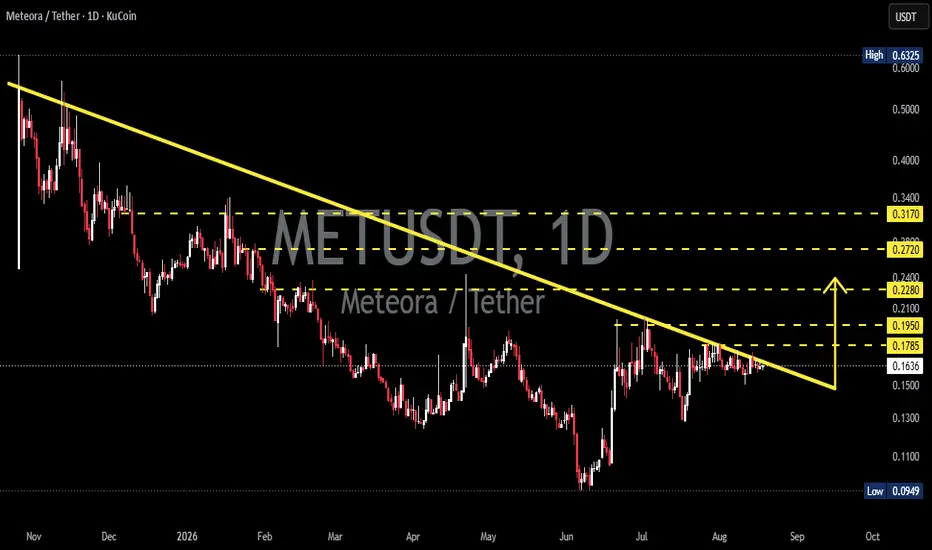
📊 Market Overview Meteora (MET) on the 1D timeframe is still in a medium-term bearish structure, but the price is currently showing consolidation right below the Descending Trendline.
The price is around $0.1633, making the trendline the key resistance currently being tested.
🔎 Key observation: the longer the price remains near the trendline without making a significant decline, the more important the potential breakout becomes.
📐 Pattern — Descending Trendline
🔻 The Descending Trendline is formed by a series of Lower Highs (LH) since late 2025.
📉 This trendline acts as dynamic resistance and has repeatedly pushed the price lower.
⚠️ As long as the price remains below the trendline, the overall structure remains bearish.
🔥 However, if a Daily Candle Close occurs above the trendline, the structure could shift toward a bullish reversal / breakout setup.
📌 Breakout confirmation would be stronger if accompanied by:
📈 Increasing volume
🕯️ Daily close above the trendline
🔄 Successful retest of the trendline as support
🚀 Price beginning to form Higher Highs and Higher Lows
🎯 Key Resistance Levels
R1 — $0.1785 🔸 Nearest resistance and the first area that needs to be broken.
R2 — $0.1950 🔸 Next resistance and an important area for measuring bullish momentum.
R3 — $0.2280 🔸 Major resistance if the breakout gains strong momentum.
R4 — $0.2720 🔸 Next resistance and an important psychological area.
R5 — $0.3170 🔸 Major bullish target marked on the chart.
🟢 Bullish Scenario
🚀 The bullish scenario becomes active if MET breaks out and achieves a Daily Close above the Descending Trendline.
If the breakout is confirmed:
➡️ $0.1785 → first resistance ➡️ $0.1950 → next target ➡️ $0.2280 → major resistance ➡️ $0.2720 → extended target ➡️ $0.3170 → major bullish target
🔥 If the price successfully breaks above $0.2280 with strong volume, bullish momentum could become more aggressive toward $0.2720–$0.3170.
🔄 A retest of the trendline after the breakout is also an important area to determine whether the former resistance has turned into support.
🔴 Bearish Scenario
⚠️ If MET is rejected again by the Descending Trendline and fails to break out:
📉 The price could retest the $0.1500 area.
If that support fails:
➡️ $0.1300 ➡️ $0.1100 ➡️ $0.0950 as the major low area on the chart.
❌ A failed breakout or false breakout could signal that sellers are still controlling the structure.
🧠 Conclusion
MET is currently at a crucial area below the Descending Trendline.
🔻 Below the trendline: the structure remains bearish. 🔓 Breakout + Daily Close: opens the possibility of a structural shift. 🔄 Successful Retest: provides additional confirmation. 🚀 $0.1785 → $0.1950 → $0.2280 are important resistances during the bullish move. 🎯 If momentum becomes very strong, the next levels to watch are $0.2720 and $0.3170.
📌 Most important levels right now: Descending Trendline + $0.1785.
Not financial advice. Use proper risk management and wait for price action confirmation.
#MET #Meteora #Crypto #Altcoin #CryptoTrading #TechnicalAnalysis #PriceAction #DescendingTrendline #Breakout #BullishSetup #BearishScenario #USDT #Altcoins
The price is around $0.1633, making the trendline the key resistance currently being tested.
🔎 Key observation: the longer the price remains near the trendline without making a significant decline, the more important the potential breakout becomes.
📐 Pattern — Descending Trendline
🔻 The Descending Trendline is formed by a series of Lower Highs (LH) since late 2025.
📉 This trendline acts as dynamic resistance and has repeatedly pushed the price lower.
⚠️ As long as the price remains below the trendline, the overall structure remains bearish.
🔥 However, if a Daily Candle Close occurs above the trendline, the structure could shift toward a bullish reversal / breakout setup.
📌 Breakout confirmation would be stronger if accompanied by:
📈 Increasing volume
🕯️ Daily close above the trendline
🔄 Successful retest of the trendline as support
🚀 Price beginning to form Higher Highs and Higher Lows
🎯 Key Resistance Levels
R1 — $0.1785 🔸 Nearest resistance and the first area that needs to be broken.
R2 — $0.1950 🔸 Next resistance and an important area for measuring bullish momentum.
R3 — $0.2280 🔸 Major resistance if the breakout gains strong momentum.
R4 — $0.2720 🔸 Next resistance and an important psychological area.
R5 — $0.3170 🔸 Major bullish target marked on the chart.
🟢 Bullish Scenario
🚀 The bullish scenario becomes active if MET breaks out and achieves a Daily Close above the Descending Trendline.
If the breakout is confirmed:
➡️ $0.1785 → first resistance ➡️ $0.1950 → next target ➡️ $0.2280 → major resistance ➡️ $0.2720 → extended target ➡️ $0.3170 → major bullish target
🔥 If the price successfully breaks above $0.2280 with strong volume, bullish momentum could become more aggressive toward $0.2720–$0.3170.
🔄 A retest of the trendline after the breakout is also an important area to determine whether the former resistance has turned into support.
🔴 Bearish Scenario
⚠️ If MET is rejected again by the Descending Trendline and fails to break out:
📉 The price could retest the $0.1500 area.
If that support fails:
➡️ $0.1300 ➡️ $0.1100 ➡️ $0.0950 as the major low area on the chart.
❌ A failed breakout or false breakout could signal that sellers are still controlling the structure.
🧠 Conclusion
MET is currently at a crucial area below the Descending Trendline.
🔻 Below the trendline: the structure remains bearish. 🔓 Breakout + Daily Close: opens the possibility of a structural shift. 🔄 Successful Retest: provides additional confirmation. 🚀 $0.1785 → $0.1950 → $0.2280 are important resistances during the bullish move. 🎯 If momentum becomes very strong, the next levels to watch are $0.2720 and $0.3170.
📌 Most important levels right now: Descending Trendline + $0.1785.
Not financial advice. Use proper risk management and wait for price action confirmation.
#MET #Meteora #Crypto #Altcoin #CryptoTrading #TechnicalAnalysis #PriceAction #DescendingTrendline #Breakout #BullishSetup #BearishScenario #USDT #Altcoins

✅ Get Free Signals! Join Our Telegram Channel Here: t.me/TheCryptoNuclear
✅ Twitter: twitter.com/crypto_nuclear
✅ Join Bybit : partner.bybit.com/b/nuclearvip
✅ Benefits : Lifetime Trading Fee Discount -50%
✅ Twitter: twitter.com/crypto_nuclear
✅ Join Bybit : partner.bybit.com/b/nuclearvip
✅ Benefits : Lifetime Trading Fee Discount -50%
Feragatname
Bilgiler ve yayınlar, TradingView tarafından sağlanan veya onaylanan finansal, yatırım, alım satım veya diğer türden tavsiye veya öneriler anlamına gelmez ve teşkil etmez. Kullanım Koşulları bölümünde daha fazlasını okuyun.
✅ Get Free Signals! Join Our Telegram Channel Here: t.me/TheCryptoNuclear
✅ Twitter: twitter.com/crypto_nuclear
✅ Join Bybit : partner.bybit.com/b/nuclearvip
✅ Benefits : Lifetime Trading Fee Discount -50%
✅ Twitter: twitter.com/crypto_nuclear
✅ Join Bybit : partner.bybit.com/b/nuclearvip
✅ Benefits : Lifetime Trading Fee Discount -50%
Feragatname
Bilgiler ve yayınlar, TradingView tarafından sağlanan veya onaylanan finansal, yatırım, alım satım veya diğer türden tavsiye veya öneriler anlamına gelmez ve teşkil etmez. Kullanım Koşulları bölümünde daha fazlasını okuyun.