
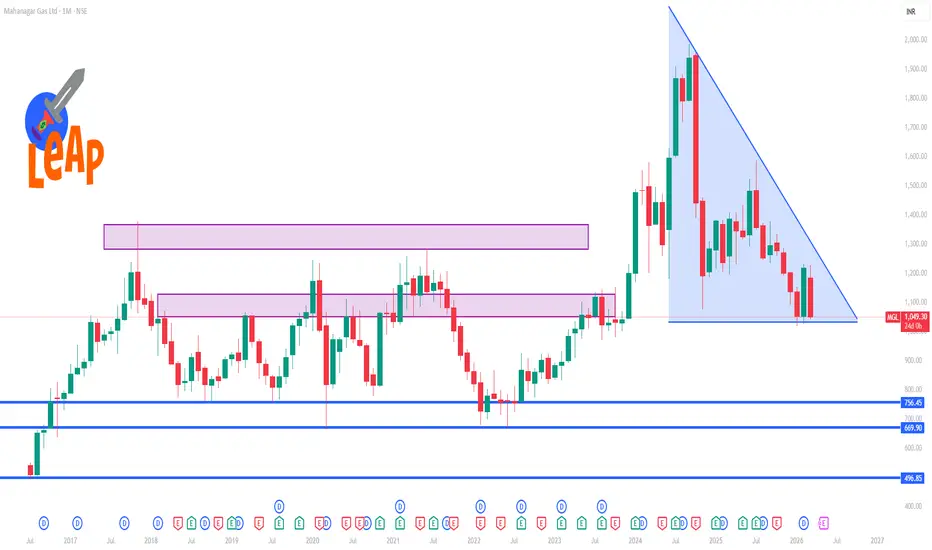
📌 Current Price Context
• Price ~ ₹1,049 – ₹1,070 per share at latest market close. The stock has traded between about ₹1,018 (52‑week low) and ₹1,587 (52‑week high) recently.
📊 1‑Month Support & Resistance Levels (Important)
Immediate Support (Downside Levels)
₹1,016 – ₹1,018 — Significant near 52‑week low support zone.
₹1,032 – ₹1,040 — Minor support zone from recent daily pivots.
₹1,054 — Short‑term support near current pivot zone.
👉 Below ₹1,016 could trigger further test of lower range around ₹980‑₹950 (more bearish extension).
Immediate Resistance (Upside Levels)
₹1,093 – ₹1,095 — First resistance from pivot breakout zones.
₹1,108 – ₹1,110 — Near mid‑range resistance cluster for the month.
₹1,120 – ₹1,130 — Next key ceiling where recent upside moves faced selling interest.
👉 Break above ₹1,130 could open a bullish move to next short‑term range around ₹1,150‑₹1,170.
📌 1‑Month Trading Interpretation
Bullish scenario:
➡️ If price holds above the ₹1,040‑₹1,054 support zone and clears ₹1,093–₹1,095, then look for a run toward ₹1,108‑₹1,120. A breakout above that could signal stronger momentum.
Bearish scenario:
➡️ If price breaks below ₹1,032‑₹1,018, risk expands into deeper support near the 52‑week low ~₹1,018 and potentially ₹950‑₹980 in an extended decline.
• Price ~ ₹1,049 – ₹1,070 per share at latest market close. The stock has traded between about ₹1,018 (52‑week low) and ₹1,587 (52‑week high) recently.
📊 1‑Month Support & Resistance Levels (Important)
Immediate Support (Downside Levels)
₹1,016 – ₹1,018 — Significant near 52‑week low support zone.
₹1,032 – ₹1,040 — Minor support zone from recent daily pivots.
₹1,054 — Short‑term support near current pivot zone.
👉 Below ₹1,016 could trigger further test of lower range around ₹980‑₹950 (more bearish extension).
Immediate Resistance (Upside Levels)
₹1,093 – ₹1,095 — First resistance from pivot breakout zones.
₹1,108 – ₹1,110 — Near mid‑range resistance cluster for the month.
₹1,120 – ₹1,130 — Next key ceiling where recent upside moves faced selling interest.
👉 Break above ₹1,130 could open a bullish move to next short‑term range around ₹1,150‑₹1,170.
📌 1‑Month Trading Interpretation
Bullish scenario:
➡️ If price holds above the ₹1,040‑₹1,054 support zone and clears ₹1,093–₹1,095, then look for a run toward ₹1,108‑₹1,120. A breakout above that could signal stronger momentum.
Bearish scenario:
➡️ If price breaks below ₹1,032‑₹1,018, risk expands into deeper support near the 52‑week low ~₹1,018 and potentially ₹950‑₹980 in an extended decline.

Contact Knowledgehub for a detailed consultation: Dm on WhatsApp: [wa.link/a2o0kz]-
Phone No: [+91 93102 26243]-
Email: [tradingviewknowledgehub@gmail.com]---
-- Let’s achieve success together!
Phone No: [+91 93102 26243]-
Email: [tradingviewknowledgehub@gmail.com]---
-- Let’s achieve success together!
İlgili yayınlar
Feragatname
Bilgiler ve yayınlar, TradingView tarafından sağlanan veya onaylanan finansal, yatırım, alım satım veya diğer türden tavsiye veya öneriler anlamına gelmez ve teşkil etmez. Kullanım Koşulları bölümünde daha fazlasını okuyun.
Contact Knowledgehub for a detailed consultation: Dm on WhatsApp: [wa.link/a2o0kz]-
Phone No: [+91 93102 26243]-
Email: [tradingviewknowledgehub@gmail.com]---
-- Let’s achieve success together!
Phone No: [+91 93102 26243]-
Email: [tradingviewknowledgehub@gmail.com]---
-- Let’s achieve success together!
İlgili yayınlar
Feragatname
Bilgiler ve yayınlar, TradingView tarafından sağlanan veya onaylanan finansal, yatırım, alım satım veya diğer türden tavsiye veya öneriler anlamına gelmez ve teşkil etmez. Kullanım Koşulları bölümünde daha fazlasını okuyun.