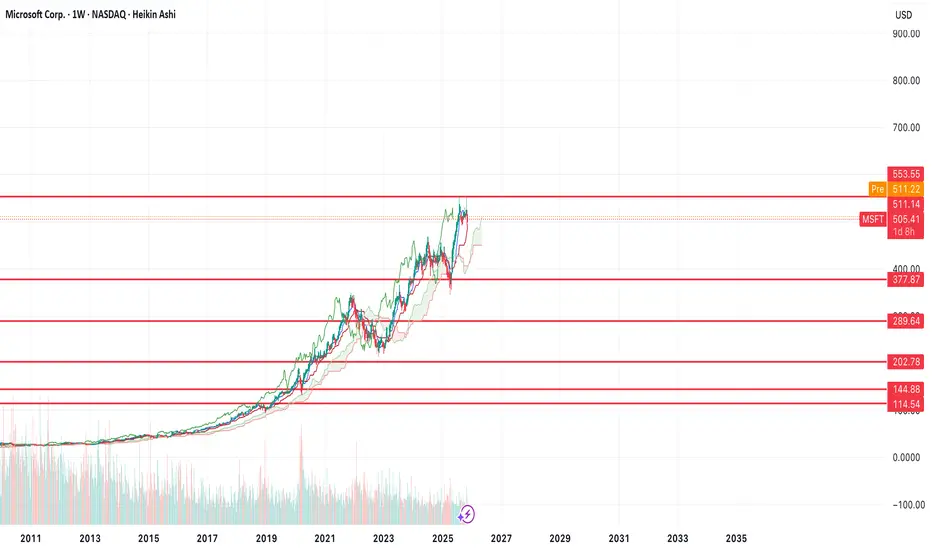
 MSFT looks like it has put in a top up at the $555 level.
This is actually one of the most bearish looking charts as I think there's potentially a longer term top being put in here.
I think it's possible that price goes to at least the $287 level, but potentially all the way down to the lower supports in the low $100s before it can see a sustained bounce.

Feragatname
Bilgiler ve yayınlar, TradingView tarafından sağlanan veya onaylanan finansal, yatırım, alım satım veya diğer türden tavsiye veya öneriler anlamına gelmez ve teşkil etmez. Kullanım Koşulları bölümünde daha fazlasını okuyun.
Feragatname
Bilgiler ve yayınlar, TradingView tarafından sağlanan veya onaylanan finansal, yatırım, alım satım veya diğer türden tavsiye veya öneriler anlamına gelmez ve teşkil etmez. Kullanım Koşulları bölümünde daha fazlasını okuyun.