Microsoft ( MSFT) Weekly: Testing 200 EMA Support Floor – Two Potential Asymmetric Long Blueprints
### 💻 Microsoft Corp. (MSFT) Weekly Technical Matrix (Ref: MSFT_2026-06-16_10-34-28.png)
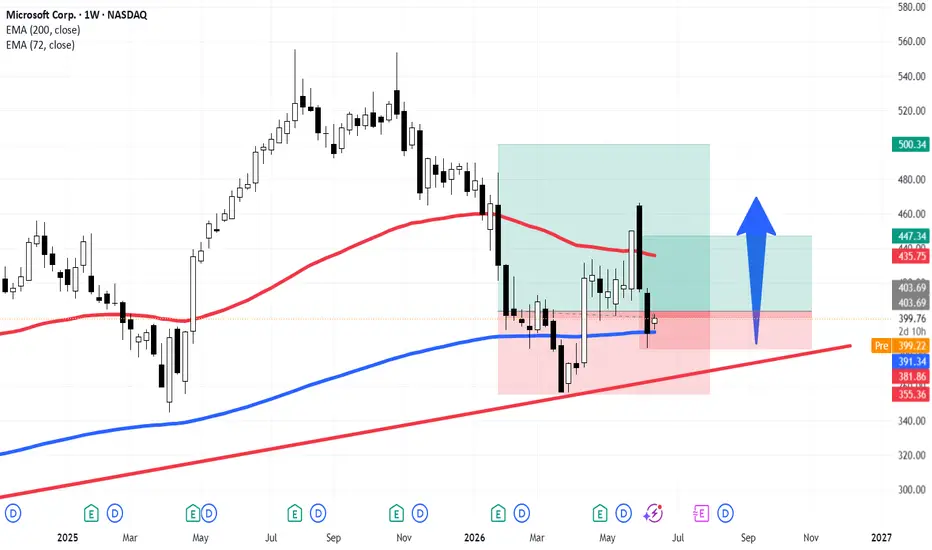
We are analyzing Microsoft Corp. (MSFT - NASDAQ) on the Weekly (1W) macro timeframe, as price action interacts directly with a major institutional demand zone.
The stock is currently trading up **+2.31% at 399.76**, sitting directly on top of the long-term **200-period EMA (blue line at 391.34)**. Given this significant dynamic support intersection, we have formulated two distinct long playbooks based on different risk-profiles and mathematical objectives.
---
### 🔎 Strategy Blueprint 1: Technical Mean-Reversion (Shorter-Term / Higher Local Risk)
* **The Setup:** This approach capitalizes on the immediate confluence between the 200 EMA and the long-term Ascending Trendline (LTA - lower diagonal red line).
* **Risk Parameters:** This trade features a tight protective stop-loss anchored right below the recent structural low at **381.86**.
* **Target Horizon:** The target is a quick rotational bounce back toward the descending **72-period EMA (red line at 435.75)** and the local liquidity level at **447.34**. While it offers a very accessible **1:1 Risk/Reward ratio** to lock in profits, it carries a slightly lower mathematical probability of extended expansion straight into 2:1 RR without consolidation.
### 🎯 Strategy Blueprint 2: Macro Swing Expansion (Longer-Term Position)
* **The Setup:** This blueprint maps out a broader structural recovery, position-trading the asset back up toward its major historical high-value zone.
* **Target Horizon:** The ultimate objective targets the upper green horizontal resistance layer at **500.34**.
* **The Warning Signal:** Caution is warranted. The market has printed **two highly aggressive, wide-range bearish weekly candles** leading into this support. This heavy selling momentum indicates that institutional distribution is still stabilizing, and price may require an accumulation phase or a liquidity sweep before validating a multi-week upward reversal.
---
### 📊 System Philosophy & Edge Probability
At **ChartPro Data**, we reinforce that no technical setup guarantees a future outcome. Our methodology does not attempt to predict the market; instead, we systematically locate structural edge zones where the historical win rate combined with a solid **2:1 Risk/Reward profile** tilts the mathematical expectancy firmly in our favor over a series of executions.
Let the weekly candle close define the structural validation before executing allocation sizes.
---
📊 **ChartPro Data** | By Rogerio Zaglia
*Equity Architecture, Macro Technical Research & Systematic Risk Engineering.*
⚠️ **Disclaimer:** For educational and informational purposes only. This technical analysis represents a personal trading framework and does not constitute financial or investment advice.
MSFT) Weekly: Testing 200 EMA Support Floor – Two Potential Asymmetric Long Blueprints### 💻 Microsoft Corp. (
MSFT) Weekly Technical Matrix (Ref: MSFT_2026-06-16_10-34-28.png)We are analyzing Microsoft Corp. (
MSFT - NASDAQ) on the Weekly (1W) macro timeframe, as price action interacts directly with a major institutional demand zone. The stock is currently trading up **+2.31% at 399.76**, sitting directly on top of the long-term **200-period EMA (blue line at 391.34)**. Given this significant dynamic support intersection, we have formulated two distinct long playbooks based on different risk-profiles and mathematical objectives.
---
### 🔎 Strategy Blueprint 1: Technical Mean-Reversion (Shorter-Term / Higher Local Risk)
* **The Setup:** This approach capitalizes on the immediate confluence between the 200 EMA and the long-term Ascending Trendline (LTA - lower diagonal red line).
* **Risk Parameters:** This trade features a tight protective stop-loss anchored right below the recent structural low at **381.86**.
* **Target Horizon:** The target is a quick rotational bounce back toward the descending **72-period EMA (red line at 435.75)** and the local liquidity level at **447.34**. While it offers a very accessible **1:1 Risk/Reward ratio** to lock in profits, it carries a slightly lower mathematical probability of extended expansion straight into 2:1 RR without consolidation.
### 🎯 Strategy Blueprint 2: Macro Swing Expansion (Longer-Term Position)
* **The Setup:** This blueprint maps out a broader structural recovery, position-trading the asset back up toward its major historical high-value zone.
* **Target Horizon:** The ultimate objective targets the upper green horizontal resistance layer at **500.34**.
* **The Warning Signal:** Caution is warranted. The market has printed **two highly aggressive, wide-range bearish weekly candles** leading into this support. This heavy selling momentum indicates that institutional distribution is still stabilizing, and price may require an accumulation phase or a liquidity sweep before validating a multi-week upward reversal.
---
### 📊 System Philosophy & Edge Probability
At **ChartPro Data**, we reinforce that no technical setup guarantees a future outcome. Our methodology does not attempt to predict the market; instead, we systematically locate structural edge zones where the historical win rate combined with a solid **2:1 Risk/Reward profile** tilts the mathematical expectancy firmly in our favor over a series of executions.
Let the weekly candle close define the structural validation before executing allocation sizes.
---
📊 **ChartPro Data** | By Rogerio Zaglia
*Equity Architecture, Macro Technical Research & Systematic Risk Engineering.*
⚠️ **Disclaimer:** For educational and informational purposes only. This technical analysis represents a personal trading framework and does not constitute financial or investment advice.

Feragatname
Bilgiler ve yayınlar, TradingView tarafından sağlanan veya onaylanan finansal, yatırım, alım satım veya diğer türden tavsiye veya öneriler anlamına gelmez ve teşkil etmez. Kullanım Koşulları bölümünde daha fazlasını okuyun.
Feragatname
Bilgiler ve yayınlar, TradingView tarafından sağlanan veya onaylanan finansal, yatırım, alım satım veya diğer türden tavsiye veya öneriler anlamına gelmez ve teşkil etmez. Kullanım Koşulları bölümünde daha fazlasını okuyun.