
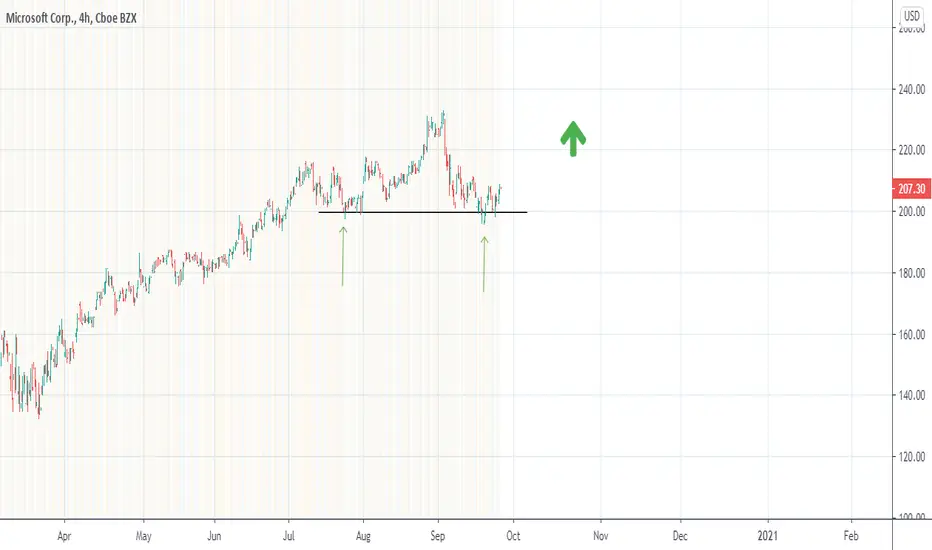
After the fall of these last weeks (fall that has occurred in all markets, not in Microsoft exclusively), a rejection at lower prices appears again (the last arrow), prices that have already been tested (in the first arrow)
Is this a double bottom pattern or is it in range?
I would say that it is a semi-range with greatly bullish connotations, personally I would open a bullish ratio straddle 2: 1
Is this a double bottom pattern or is it in range?
I would say that it is a semi-range with greatly bullish connotations, personally I would open a bullish ratio straddle 2: 1

Feragatname
Bilgiler ve yayınlar, TradingView tarafından sağlanan veya onaylanan finansal, yatırım, alım satım veya diğer türden tavsiye veya öneriler anlamına gelmez ve teşkil etmez. Kullanım Koşulları bölümünde daha fazlasını okuyun.
Feragatname
Bilgiler ve yayınlar, TradingView tarafından sağlanan veya onaylanan finansal, yatırım, alım satım veya diğer türden tavsiye veya öneriler anlamına gelmez ve teşkil etmez. Kullanım Koşulları bölümünde daha fazlasını okuyun.