
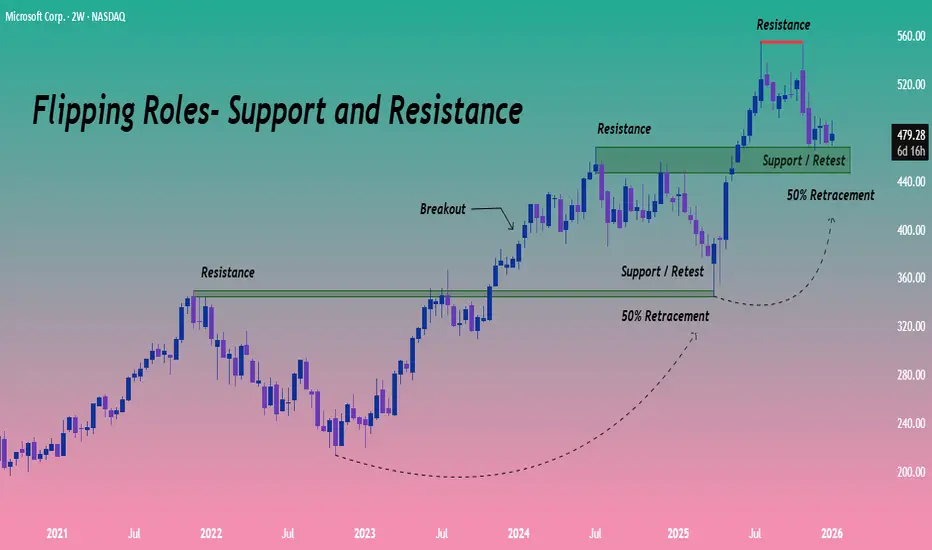
➡ One of the most basic principles in technical analysis is that when price breaks above a well-defined resistance, that same level often flips its role and starts acting as support. This happens because what was once a selling zone becomes an area where buyers are now willing to step in.
MSFT presents a textbook example of this behavior.
➡ In late 2023, the stock delivered a strong breakout above resistance zone of 350. After the breakout, price rallied nearly 30% before pulling back to retest this same area. That retest also aligned closely with the 50% retracement of the entire rally from the October 2022 lows to the July 2024 highs, adding further technical significance to the zone.
➡ The successful hold of this former resistance led to an even stronger move. MSFT then went on to stage a sharp rally of nearly 60%, advancing from around 344 to 555.
➡ At present, the stock is once again in a corrective phase, moving back toward the 450 zone- a level that previously acted as resistance and now has the potential to function as support.
➡ If this zone manages to hold, the probability of another upside leg increases, and a move back toward 555 or even higher levels cannot be ruled out.
Share your thoughts in the comment section below.
Thanks for reading.
📣Disclaimer:
Everything shared in this idea is meant for education and general awareness only. It’s neither a financial advice, nor a recommendation to buy, sell, or hold any asset. Do your own research, manage your risk, and make sure you understand what you’re getting into.
MSFT presents a textbook example of this behavior.
➡ In late 2023, the stock delivered a strong breakout above resistance zone of 350. After the breakout, price rallied nearly 30% before pulling back to retest this same area. That retest also aligned closely with the 50% retracement of the entire rally from the October 2022 lows to the July 2024 highs, adding further technical significance to the zone.
➡ The successful hold of this former resistance led to an even stronger move. MSFT then went on to stage a sharp rally of nearly 60%, advancing from around 344 to 555.
➡ At present, the stock is once again in a corrective phase, moving back toward the 450 zone- a level that previously acted as resistance and now has the potential to function as support.
➡ If this zone manages to hold, the probability of another upside leg increases, and a move back toward 555 or even higher levels cannot be ruled out.
Share your thoughts in the comment section below.
Thanks for reading.
📣Disclaimer:
Everything shared in this idea is meant for education and general awareness only. It’s neither a financial advice, nor a recommendation to buy, sell, or hold any asset. Do your own research, manage your risk, and make sure you understand what you’re getting into.

JJ Singh
Trader/Investor
Moderator, TradingView
🚀Join t.me/jjsingh_2020 ,
A Free Education channel
🚀Tweet at twitter.com/JaySingh_2020
Trader/Investor
Moderator, TradingView
🚀Join t.me/jjsingh_2020 ,
A Free Education channel
🚀Tweet at twitter.com/JaySingh_2020
Feragatname
Bilgiler ve yayınlar, TradingView tarafından sağlanan veya onaylanan finansal, yatırım, alım satım veya diğer türden tavsiye veya öneriler anlamına gelmez ve teşkil etmez. Kullanım Koşulları bölümünde daha fazlasını okuyun.
JJ Singh
Trader/Investor
Moderator, TradingView
🚀Join t.me/jjsingh_2020 ,
A Free Education channel
🚀Tweet at twitter.com/JaySingh_2020
Trader/Investor
Moderator, TradingView
🚀Join t.me/jjsingh_2020 ,
A Free Education channel
🚀Tweet at twitter.com/JaySingh_2020
Feragatname
Bilgiler ve yayınlar, TradingView tarafından sağlanan veya onaylanan finansal, yatırım, alım satım veya diğer türden tavsiye veya öneriler anlamına gelmez ve teşkil etmez. Kullanım Koşulları bölümünde daha fazlasını okuyun.