Güncellendi
Metal's Weekly Chart Looking Very Bullish!
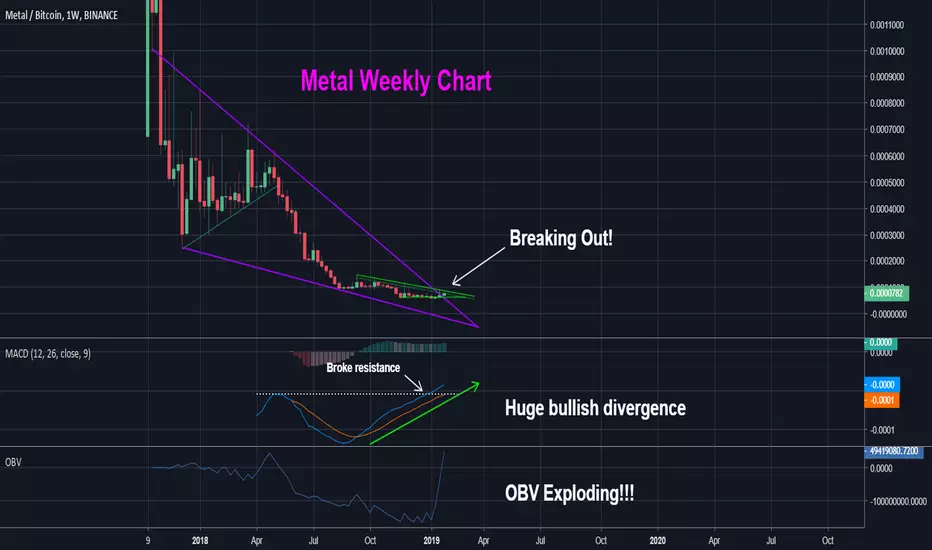
I like what I see here on the weekly chart.
1) Massive bullish divergence since August on MACD and the MACD indicator just just broke through overhead resistance
2) OBV is going through the roof
3) RSI is in coming out of the oversold range, but is still low at 34
4) Price is potentially breaking out of a long-term falling wedge
5) 40x off its all-time high
Hopefully this won't be railroaded by a Bitcoin collapse. But if BTC can remain stable, Metal might be ready for a bull run of its own.
1) Massive bullish divergence since August on MACD and the MACD indicator just just broke through overhead resistance
2) OBV is going through the roof
3) RSI is in coming out of the oversold range, but is still low at 34
4) Price is potentially breaking out of a long-term falling wedge
5) 40x off its all-time high
Hopefully this won't be railroaded by a Bitcoin collapse. But if BTC can remain stable, Metal might be ready for a bull run of its own.
Not

Feragatname
Bilgiler ve yayınlar, TradingView tarafından sağlanan veya onaylanan finansal, yatırım, alım satım veya diğer türden tavsiye veya öneriler anlamına gelmez ve teşkil etmez. Kullanım Koşulları bölümünde daha fazlasını okuyun.
Feragatname
Bilgiler ve yayınlar, TradingView tarafından sağlanan veya onaylanan finansal, yatırım, alım satım veya diğer türden tavsiye veya öneriler anlamına gelmez ve teşkil etmez. Kullanım Koşulları bölümünde daha fazlasını okuyun.