
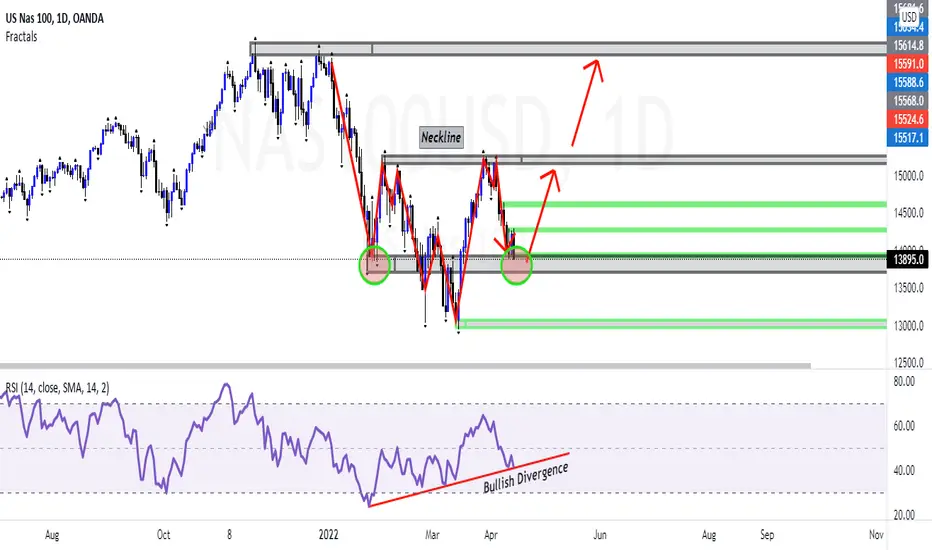
Monthly has large wicks rejecting 14000 price area. 2 months back-to-back. Monthly Bullish Engulfing as well.
Weekly candle stick analysis could be a double bottom forming or a higher low. Due to Daily analysis expecting this to be a weekly higher low.
Daily has created an inverse head & shoulder pattern with bullish divergence.
If price rejects this zone and breaks structure for turnaround of buys. Expecting price to continue pattern to upside near 15600 long term.

Feragatname
Bilgiler ve yayınlar, TradingView tarafından sağlanan veya onaylanan finansal, yatırım, alım satım veya diğer türden tavsiye veya öneriler anlamına gelmez ve teşkil etmez. Kullanım Koşulları bölümünde daha fazlasını okuyun.
Feragatname
Bilgiler ve yayınlar, TradingView tarafından sağlanan veya onaylanan finansal, yatırım, alım satım veya diğer türden tavsiye veya öneriler anlamına gelmez ve teşkil etmez. Kullanım Koşulları bölümünde daha fazlasını okuyun.