
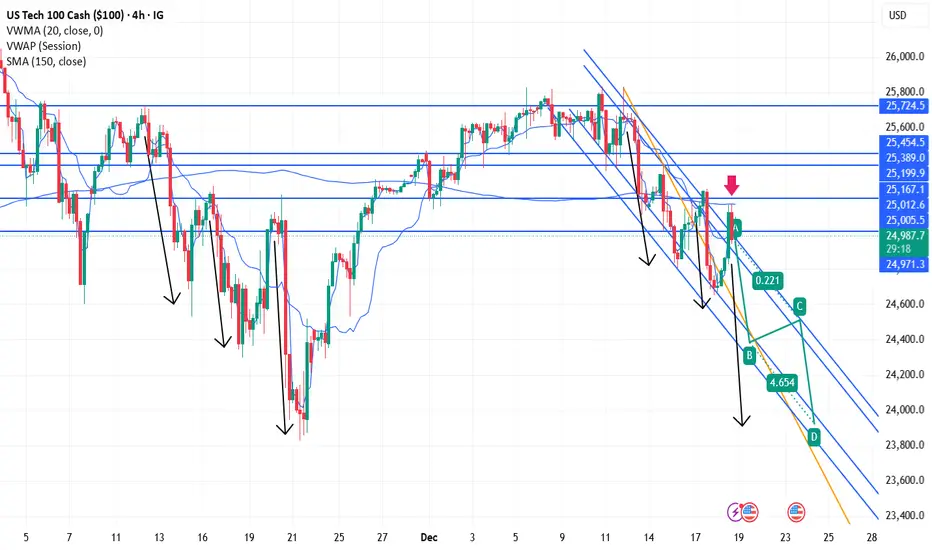
From Thursday's closed around 25 000, looks to me, like the downtrend channel may be maintained, with todays breakout failing. The 4 hourly rose up and was rejected at the 150 sma (pink arrow). So thinking it now will retest the 23850 lows.
I think it will do this in a 2 leg more or less equal measured move down. At an estimate first to ~24350, then less of a rally than the last couple we have had, and more of a slow retrace back to ~24500 - more flag like, then down 23850 ish. Though it could potentially do that in one move on friday. Possible, but a bit of a stretch for one day though, unless some rather dire news happens to coincide tomorrow. The visible range volume profile certainly seems to adequately accommodate a move to 24350, with little problem, while less so to ~24000k in my interpretation, yet, i still feel the price will need to go there as a significant low.
Of interest, it is also setting up to look similar to a period of last months chart - see set of three thin black arrows. If it stays similar this pattern, then that would suggest a one leg down move, like we had then. But that is a less probable scenario i think, barring any particularity bad news event. So this similarity is mentioned more as a point of interest, as it doesnt have a technical basis of which i am aware.
This could all be a load of nonsense of course, and it breaks out back up!

Feragatname
Bilgiler ve yayınlar, TradingView tarafından sağlanan veya onaylanan finansal, yatırım, alım satım veya diğer türden tavsiye veya öneriler anlamına gelmez ve teşkil etmez. Kullanım Koşulları bölümünde daha fazlasını okuyun.
Feragatname
Bilgiler ve yayınlar, TradingView tarafından sağlanan veya onaylanan finansal, yatırım, alım satım veya diğer türden tavsiye veya öneriler anlamına gelmez ve teşkil etmez. Kullanım Koşulları bölümünde daha fazlasını okuyun.