nasdaq100....h
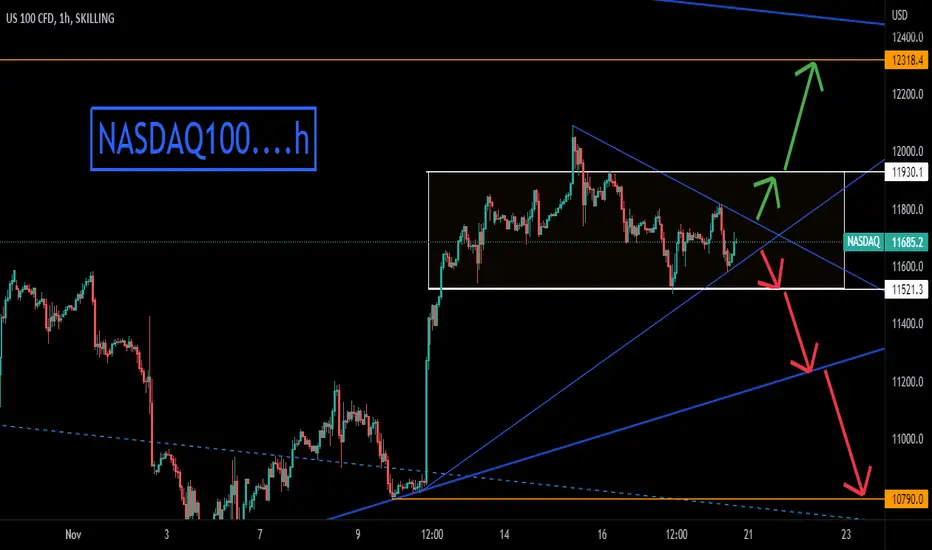
= Nasdaq analysis on the hourly chart
= The analysis is based on trend analysis, support and resistance
= Currently, it is on an occasional path between support and resistance.. breaking it goes to the selling targets... and exceeding it goes to the buying targets
= The analysis is based on trend analysis, support and resistance
= Currently, it is on an occasional path between support and resistance.. breaking it goes to the selling targets... and exceeding it goes to the buying targets

Feragatname
Bilgiler ve yayınlar, TradingView tarafından sağlanan veya onaylanan finansal, yatırım, alım satım veya diğer türden tavsiye veya öneriler anlamına gelmez ve teşkil etmez. Kullanım Koşulları bölümünde daha fazlasını okuyun.
Feragatname
Bilgiler ve yayınlar, TradingView tarafından sağlanan veya onaylanan finansal, yatırım, alım satım veya diğer türden tavsiye veya öneriler anlamına gelmez ve teşkil etmez. Kullanım Koşulları bölümünde daha fazlasını okuyun.