
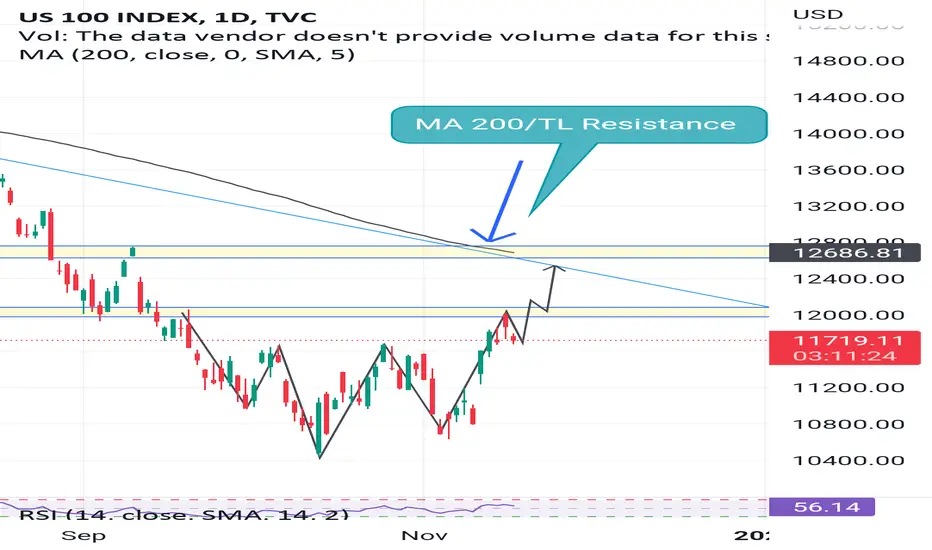
Nasdaq creating inverse head and shoulder pattern on daily chart and now testing the breakout neck line
It can easily go up to upper trendline and 200 Ma area which is also last high low were it has to chance to start fadingout as we are still in bear market 🐻
Micro bulish
Macro bearish
DYOR!
It can easily go up to upper trendline and 200 Ma area which is also last high low were it has to chance to start fadingout as we are still in bear market 🐻
Micro bulish
Macro bearish
DYOR!

Feragatname
Bilgiler ve yayınlar, TradingView tarafından sağlanan veya onaylanan finansal, yatırım, alım satım veya diğer türden tavsiye veya öneriler anlamına gelmez ve teşkil etmez. Kullanım Koşulları bölümünde daha fazlasını okuyun.
Feragatname
Bilgiler ve yayınlar, TradingView tarafından sağlanan veya onaylanan finansal, yatırım, alım satım veya diğer türden tavsiye veya öneriler anlamına gelmez ve teşkil etmez. Kullanım Koşulları bölümünde daha fazlasını okuyun.