
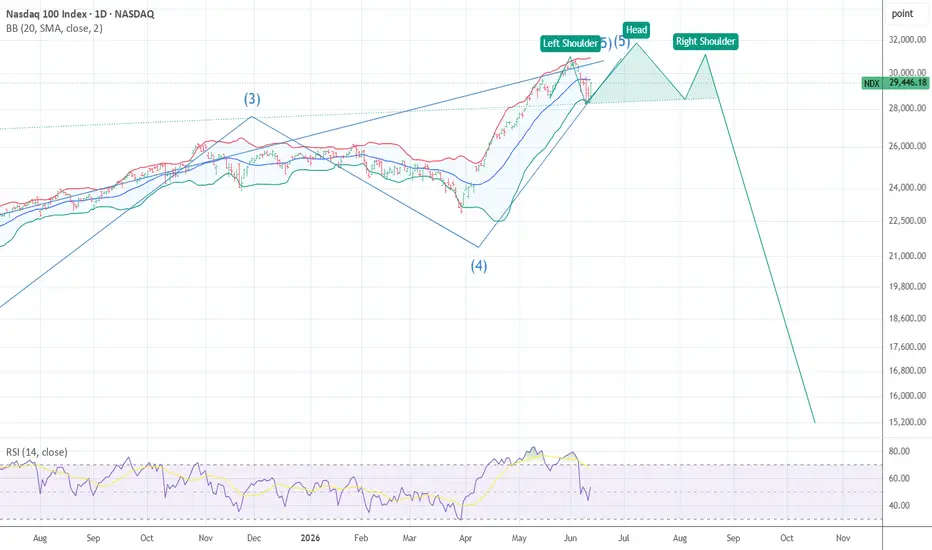
The chart is that of NDX 100 This is how I see the formation that is likely to form based on My work of cycle and spirals We by what I think the structure will form ! I have posted The math on the last chart for NDX high still ahead ! So I will keep it simple with this post until or otherwise I feel it would Not be the right formation BUT based on The cycles . best of trdaes WAVETIMER I took profits Again today .
İşlem aktif
6/15 I moved from calls on friday closed to 85 % PUTS in the sp 500 today at 7570 and will move to 120% long puts is the sp cash can rally to 7660 to 7741 THe up phase in the cycle is down into 10/16
Feragatname
Bilgiler ve yayınlar, TradingView tarafından sağlanan veya onaylanan finansal, yatırım, alım satım veya diğer türden tavsiye veya öneriler anlamına gelmez ve teşkil etmez. Kullanım Koşulları bölümünde daha fazlasını okuyun.
Feragatname
Bilgiler ve yayınlar, TradingView tarafından sağlanan veya onaylanan finansal, yatırım, alım satım veya diğer türden tavsiye veya öneriler anlamına gelmez ve teşkil etmez. Kullanım Koşulları bölümünde daha fazlasını okuyun.