
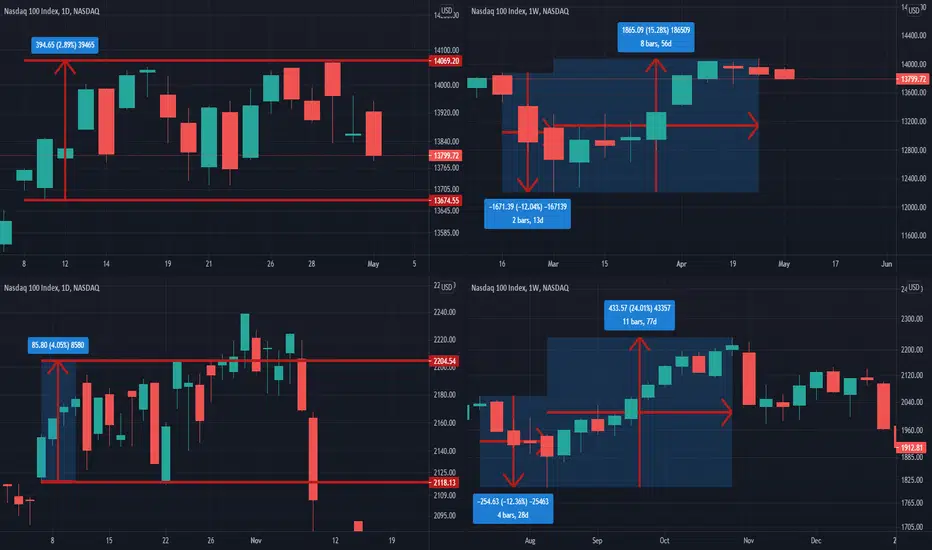
Above charts: daily chart since April 9th 2021and weekly chart since mid-February 2021.
Below cheats: daily chart since October 5th, 2007 and weekly chart since July 2007. (just before market crash)
I think these chart patterns have lots of similarities, you may argue that, but always it is better to be cautious.
If a similar scenario happening in the coming days, do you have a plan for that?
Below cheats: daily chart since October 5th, 2007 and weekly chart since July 2007. (just before market crash)
I think these chart patterns have lots of similarities, you may argue that, but always it is better to be cautious.
If a similar scenario happening in the coming days, do you have a plan for that?

Use the following link to access trading ideas: patreon.com/SniperTraderStocks?utm_medium=unknown&utm_source=join_link&utm_campaign=creatorshare_creator&utm_content=copyLink
Feragatname
Bilgiler ve yayınlar, TradingView tarafından sağlanan veya onaylanan finansal, yatırım, alım satım veya diğer türden tavsiye veya öneriler anlamına gelmez ve teşkil etmez. Kullanım Koşulları bölümünde daha fazlasını okuyun.
Use the following link to access trading ideas: patreon.com/SniperTraderStocks?utm_medium=unknown&utm_source=join_link&utm_campaign=creatorshare_creator&utm_content=copyLink
Feragatname
Bilgiler ve yayınlar, TradingView tarafından sağlanan veya onaylanan finansal, yatırım, alım satım veya diğer türden tavsiye veya öneriler anlamına gelmez ve teşkil etmez. Kullanım Koşulları bölümünde daha fazlasını okuyun.