Alış
NEOUSD 4h long setup
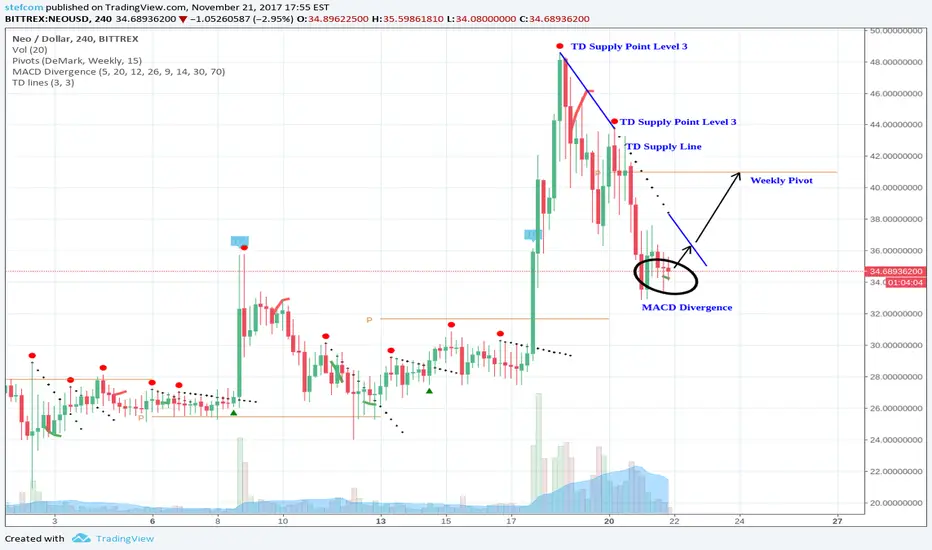
The NEOUSD 4h chart shows a Divergence of Price vs the MACD histogram.
The divergence appeared below a TD Supply Line and could indicate a trend-reversal.
When price breaks the TD Supply Line it could go up to the weekly pivot.
The divergence appeared below a TD Supply Line and could indicate a trend-reversal.
When price breaks the TD Supply Line it could go up to the weekly pivot.

⚡ Signals & Indicator & Strategy & Daily/ Weekly VIP Briefings: tradingclue.com/
⚡ GET THE CCIDivergence INDICATOR FOR FREE: bit.ly/FreeTradingViewIndicator
⚡ FREE Daily Briefings via Telegram: t.me/TradingClueBriefings
⚡ GET THE CCIDivergence INDICATOR FOR FREE: bit.ly/FreeTradingViewIndicator
⚡ FREE Daily Briefings via Telegram: t.me/TradingClueBriefings
İlgili yayınlar
Feragatname
Bilgiler ve yayınlar, TradingView tarafından sağlanan veya onaylanan finansal, yatırım, alım satım veya diğer türden tavsiye veya öneriler anlamına gelmez ve teşkil etmez. Kullanım Koşulları bölümünde daha fazlasını okuyun.