
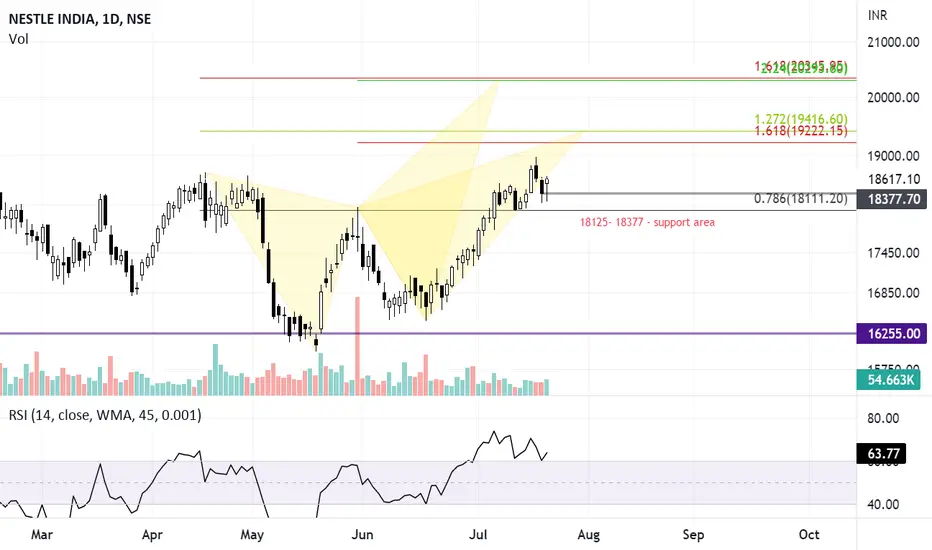
There is a probability of a butterfly pattern on the daily chart of NestleIndia.
Sustaining 18100, the stock might move towards 19200- 19400 in the coming sessions initially and then towards 20300-20350 levels.
Sustaining 18100, the stock might move towards 19200- 19400 in the coming sessions initially and then towards 20300-20350 levels.

Feragatname
Bilgiler ve yayınlar, TradingView tarafından sağlanan veya onaylanan finansal, yatırım, alım satım veya diğer türden tavsiye veya öneriler anlamına gelmez ve teşkil etmez. Kullanım Koşulları bölümünde daha fazlasını okuyun.
Feragatname
Bilgiler ve yayınlar, TradingView tarafından sağlanan veya onaylanan finansal, yatırım, alım satım veya diğer türden tavsiye veya öneriler anlamına gelmez ve teşkil etmez. Kullanım Koşulları bölümünde daha fazlasını okuyun.