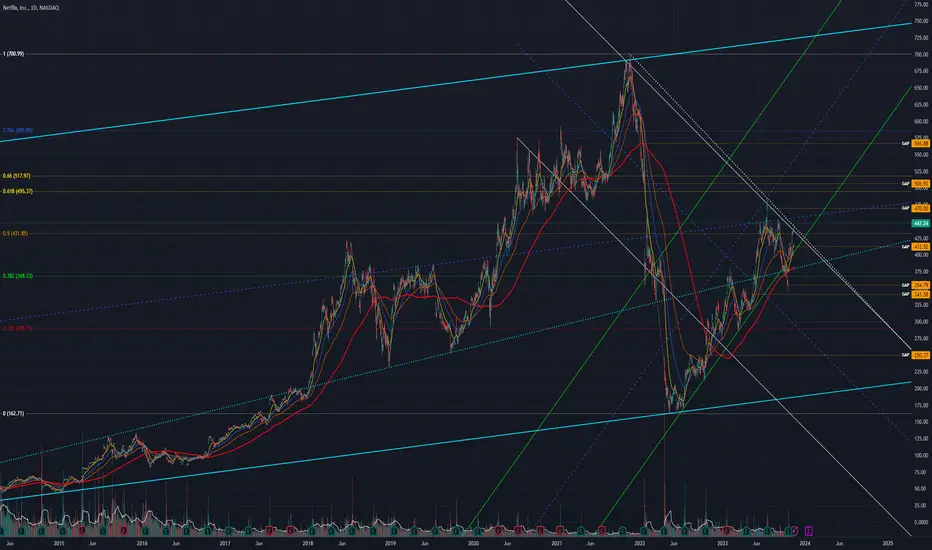
 NFLX chart mapping/analysis.
Bullish recovery back into ascending parallel channel (green).
Bull target(s)
- Breakout descending parallel channel (white) + descending trend-line confluence resistance
- Overhead gap fills (~470 / ~506.93 / ~566.88)
- Golden Pocket Fib + gap fill (~506.93) confluence resistance zone
Bear target(s)
- Underlying gap fills (~412.52 / ~354.79 / ~341.38)
- Ascending trend-line support (light blue dotted)
- 38.2% Fib
- 23.6% Fib
Not
Note: TradingView chart was dividend adjusted (ADJ) when mapped.Not
NFLX strong bullish momentum into ~480 overhead supply zone.Could see consolidation before EOY surge towards Golden Pocket Fib/~500 psychological level, otherwise sellers retake control & stage a bearish mean reversion, TBC.

İlgili yayınlar
Feragatname
Bilgiler ve yayınlar, TradingView tarafından sağlanan veya onaylanan finansal, yatırım, alım satım veya diğer türden tavsiye veya öneriler anlamına gelmez ve teşkil etmez. Kullanım Koşulları bölümünde daha fazlasını okuyun.
İlgili yayınlar
Feragatname
Bilgiler ve yayınlar, TradingView tarafından sağlanan veya onaylanan finansal, yatırım, alım satım veya diğer türden tavsiye veya öneriler anlamına gelmez ve teşkil etmez. Kullanım Koşulları bölümünde daha fazlasını okuyun.