
NIFTY 50 – Close Below 50 EMA & SMA | Downside Levels Identified
Technical View:
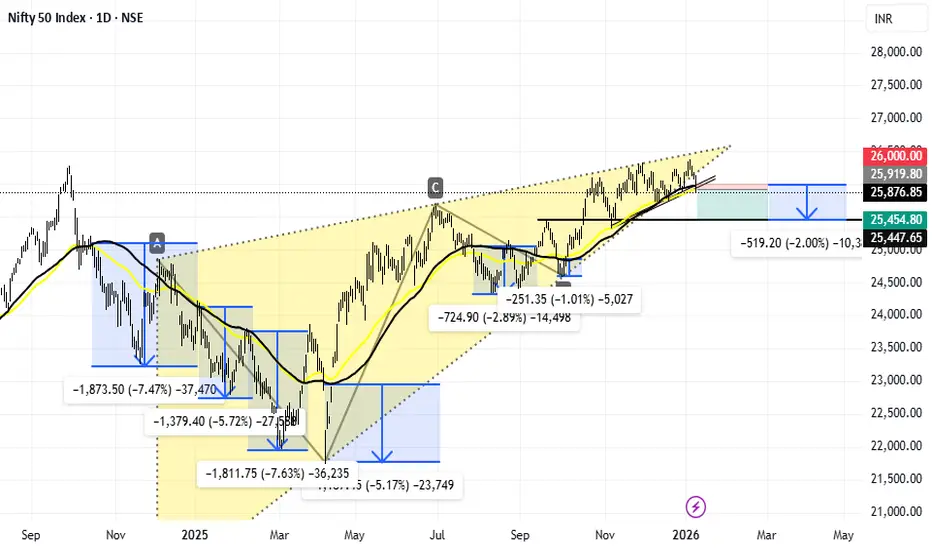
Over the last two years, NIFTY has consistently shown that a daily close below both the 50 EMA and 50 SMA results in an average correction of 4–5%.
🔍 Current Structure:
Price has closed below 50 EMA & 50 SMA
Rising wedge structure near the top → breakdown risk
Weak follow-through after the recent high
🎯 Downside Levels (Supports & Targets)
🔹 Immediate Support: 25,450 – 25,400
(Recent demand zone & neckline support)
🔹 Target 1 (≈2%): 25,350 – 25,250
(First reaction zone after breakdown)
🔹 Target 2 (≈3%): 25,100 – 25,000
(Psychological level + prior consolidation)
🔹 Extended Target (4–5%): 24,600 – 24,400
(Historical average correction zone based on EMA/SMA breakdowns)
📌 Invalidation / Resistance
Resistance: 25,900 – 26,000
(A move back above this zone negates the immediate bearish view)
⚠️ Disclaimer:
This analysis is based purely on technical probabilities and historical behavior. Not a buy/sell recommendation. Use strict risk management.
Over the last two years, NIFTY has consistently shown that a daily close below both the 50 EMA and 50 SMA results in an average correction of 4–5%.
🔍 Current Structure:
Price has closed below 50 EMA & 50 SMA
Rising wedge structure near the top → breakdown risk
Weak follow-through after the recent high
🎯 Downside Levels (Supports & Targets)
🔹 Immediate Support: 25,450 – 25,400
(Recent demand zone & neckline support)
🔹 Target 1 (≈2%): 25,350 – 25,250
(First reaction zone after breakdown)
🔹 Target 2 (≈3%): 25,100 – 25,000
(Psychological level + prior consolidation)
🔹 Extended Target (4–5%): 24,600 – 24,400
(Historical average correction zone based on EMA/SMA breakdowns)
📌 Invalidation / Resistance
Resistance: 25,900 – 26,000
(A move back above this zone negates the immediate bearish view)
⚠️ Disclaimer:
This analysis is based purely on technical probabilities and historical behavior. Not a buy/sell recommendation. Use strict risk management.
İşlem aktif
🔄 What to Expect NextA retest of the 26,000 resistance zone is likely
This zone also aligns with EMA/SMA resistance
Selling pressure is expected near 26,000
If rejection occurs, the downward move may resume
🎯 Downside Levels (Supports & Targets)
🔹 Immediate Support: 25,450 – 25,400 (tested)
🔹 Target 1 (≈2%): 25,350 – 25,250
🔹 Target 2 (≈3%): 25,100 – 25,000
🔹 Extended Target (4–5%): 24,600 – 24,400

Feragatname
Bilgiler ve yayınlar, TradingView tarafından sağlanan veya onaylanan finansal, yatırım, alım satım veya diğer türden tavsiye veya öneriler anlamına gelmez ve teşkil etmez. Kullanım Koşulları bölümünde daha fazlasını okuyun.
Feragatname
Bilgiler ve yayınlar, TradingView tarafından sağlanan veya onaylanan finansal, yatırım, alım satım veya diğer türden tavsiye veya öneriler anlamına gelmez ve teşkil etmez. Kullanım Koşulları bölümünde daha fazlasını okuyun.