
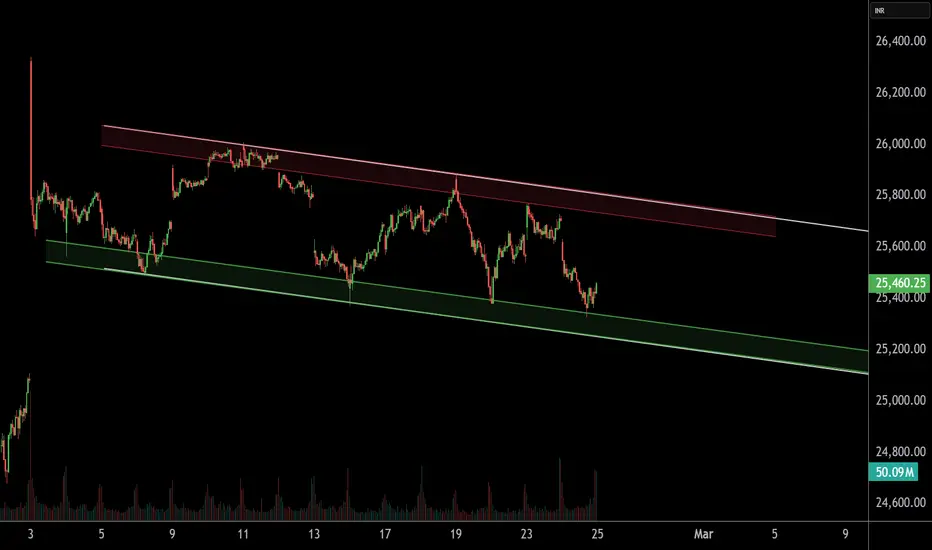
NIFTY 50 – 15-Minute Timeframe Analysis
On the 15-minute chart, NIFTY 50 is currently trading within a falling channel pattern.
Key Support Zone: 25,240 – 25,300
As long as this support zone sustains, we may witness a potential bounce from current levels.
Upside Targets: 25,700 – 25,800
A sustained hold above the support zone could trigger short-term bullish momentum.
THANK YOU !!

@RahulSarawagi
Connect us at optionlab.co.in/
Connect us at optionlab.co.in/
Feragatname
Bilgiler ve yayınlar, TradingView tarafından sağlanan veya onaylanan finansal, yatırım, alım satım veya diğer türden tavsiye veya öneriler anlamına gelmez ve teşkil etmez. Kullanım Koşulları bölümünde daha fazlasını okuyun.