
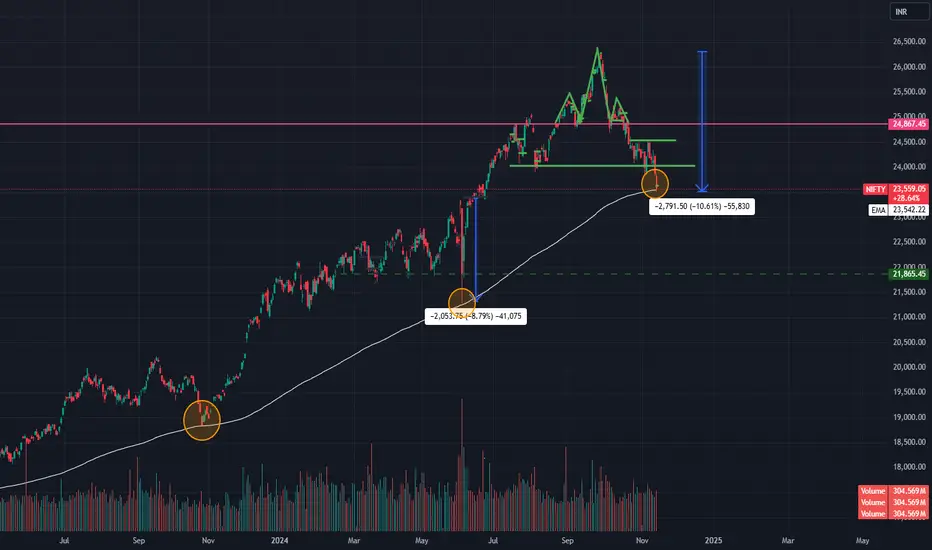
"In recent days, Nifty has formed a bearish head and shoulder pattern, indicating potential downside. It has currently reached 26,277.34, which is approximately 10.50% below its previous high. The 23,500 level is a crucial support zone, coinciding with the 200-day Exponential Moving Average (EMA). Historically, Nifty has tended to bounce off this 200-EMA.
However, it's important to note that market sentiment has turned bearish. Therefore, a prudent strategy would be to adopt a cautious approach, considering selling into rallies until we receive clear signs of upward momentum."
However, it's important to note that market sentiment has turned bearish. Therefore, a prudent strategy would be to adopt a cautious approach, considering selling into rallies until we receive clear signs of upward momentum."

Feragatname
Bilgiler ve yayınlar, TradingView tarafından sağlanan veya onaylanan finansal, yatırım, alım satım veya diğer türden tavsiye veya öneriler anlamına gelmez ve teşkil etmez. Kullanım Koşulları bölümünde daha fazlasını okuyun.
Feragatname
Bilgiler ve yayınlar, TradingView tarafından sağlanan veya onaylanan finansal, yatırım, alım satım veya diğer türden tavsiye veya öneriler anlamına gelmez ve teşkil etmez. Kullanım Koşulları bölümünde daha fazlasını okuyun.