
Nifty 10459
Weekly Chart analysis
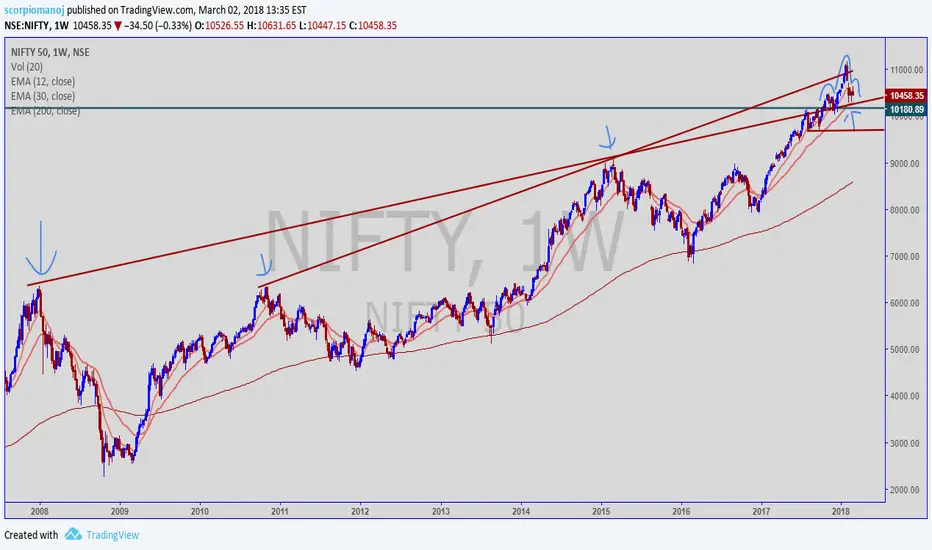
1) Long term resistance turned support zone at 10300 - 10350 levels.
2) 30 week ema at 10285-10300 levels.
3) A potential H & S pattern INCOMPLETE set up observed. Left Shoulder and Head complete; however Right Shoulder may or may not happen. If index breaks 10285-10300 levels right shoulder would be completed. This means that Index would be below long term resistance turned support, 30 week ema and neckline of H&S. The next support would be at 9680-9700.
4) Number of stocks below 30 ema is at 31 out of 50, meaning 62% of nifty stocks trading below 30 ema.
5) NHNL indicator also has broken the trendline support (not shown here).
Conclusion : If nifty breaks below 10285, it is time to go short nifty / nifty related stocks with 30 week trailing ema as stops and exits.
Weekly Chart analysis
1) Long term resistance turned support zone at 10300 - 10350 levels.
2) 30 week ema at 10285-10300 levels.
3) A potential H & S pattern INCOMPLETE set up observed. Left Shoulder and Head complete; however Right Shoulder may or may not happen. If index breaks 10285-10300 levels right shoulder would be completed. This means that Index would be below long term resistance turned support, 30 week ema and neckline of H&S. The next support would be at 9680-9700.
4) Number of stocks below 30 ema is at 31 out of 50, meaning 62% of nifty stocks trading below 30 ema.
5) NHNL indicator also has broken the trendline support (not shown here).
Conclusion : If nifty breaks below 10285, it is time to go short nifty / nifty related stocks with 30 week trailing ema as stops and exits.

Trading is my passion.
Feragatname
Bilgiler ve yayınlar, TradingView tarafından sağlanan veya onaylanan finansal, yatırım, alım satım veya diğer türden tavsiye veya öneriler anlamına gelmez ve teşkil etmez. Kullanım Koşulları bölümünde daha fazlasını okuyun.
Trading is my passion.
Feragatname
Bilgiler ve yayınlar, TradingView tarafından sağlanan veya onaylanan finansal, yatırım, alım satım veya diğer türden tavsiye veya öneriler anlamına gelmez ve teşkil etmez. Kullanım Koşulları bölümünde daha fazlasını okuyun.