
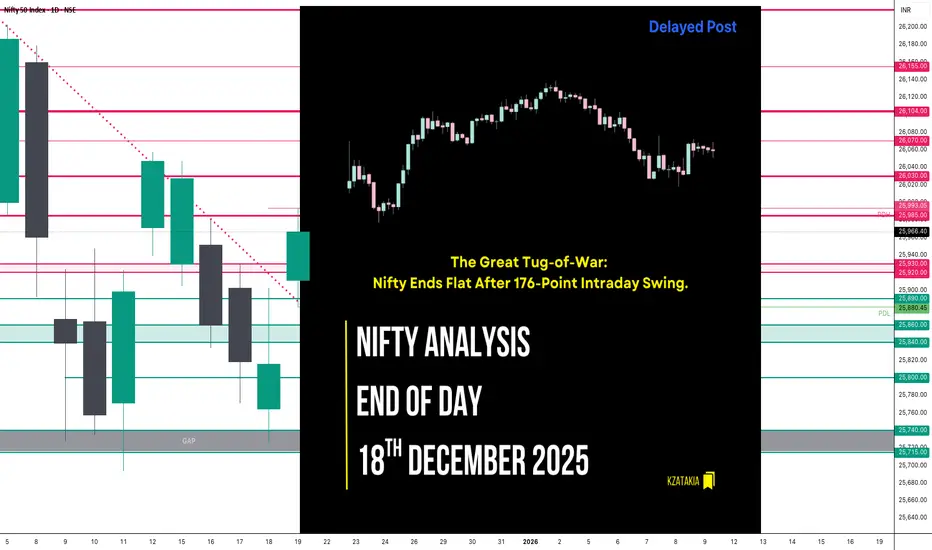
🟢 Nifty Analysis EOD – December 18, 2025 – Thursday 🔴
The Great Tug-of-War: Nifty Ends Flat After 176-Point Intraday Swing.
🗞 Nifty Summary
The Nifty opened with a 52-point Gap Up, which was immediately liquidated within the first candle, leading to a slip toward the 25715 ~ 25740 support zone. After marking an intraday low at 25,726.30, a sharp recovery rally pushed the index north to test the 25840 ~ 25860 resistance.
Bulls showed conviction by breaching this zone and reaching a day high of 25,902.35. However, the 25890 level proved to be a formidable wall, triggering a sharp reversal of over 125 points.
The 25800 psychological level eventually came to the rescue, and a late 50-point recovery allowed the Nifty to close at 25,815.55. The day ended virtually unchanged (-3.00 points, -0.01%), reflecting a fierce battle for territory where neither side could secure a decisive victory.
🛡 5 Min Intraday Chart with Levels

🛡 Intraday Walk
The session was a classic example of “two-way business.” The initial plunge and V-shaped recovery presented excellent opportunities for agile traders.
The most significant technical event was the failure to sustain above 25900, which led to a waterfall sell-off back to the 25800 base. This “round trip” highlights the heavy supply sitting near the 25890 ~ 25920 zone.
While bulls defended the 25700 base early on, their struggle to hold higher ground indicates that the market remains in a cautious consolidation phase.
📉 Daily Time Frame Chart with Intraday Levels

🕯 Daily Candle Breakdown
Open: 25,764.70
High: 25,902.35
Low: 25,726.30
Close: 25,815.55
Change: −3.00 (−0.01%)
🏗️ Structure Breakdown
Type: Small-body indecision candle (Spinning Top).
Range (High–Low): ≈ 176 points — reflecting relatively high intraday volatility.
Body: ≈ 51 points — small real body, indicating a lack of clear directional consensus.
Upper Wick: ≈ 87 points — strong rejection from higher levels (25900 zone).
Lower Wick: ≈ 38 points — buyers modestly defended the downside near the 25725 mark.
📚 Interpretation
The spinning top candle after such wide intraday swings signifies total equilibrium between supply and demand at the current levels. The long upper wick is the dominant feature, showing that sellers are very aggressive near 25900. However, the fact that the close remained above the open and the PDC suggests that bulls are unwilling to give up the 25800 territory just yet.
🕯 Candle Type
Spinning-Top / Indecision Candle — Signals uncertainty; the direction of the next candle will be crucial for confirming a breakout or a further breakdown.
🛡 5 Min Intraday Chart

⚔️ Gladiator Strategy Update
ATR: 191.66
IB Range: 100.85 → Medium
Market Structure: Balanced
Trade Highlights:
10:06 Long Trade - Target Hit (RR 1:3.39) (Contra Trade)
11:21 Long Trade - Target Hit (RR 1:2.28) (IBH Breakout)
Trade Summary: An exceptional day for the strategy. By identifying the early base-building at the 25726 support, the system captured a high R/R contra-long. A successful IBH breakout trade followed this as momentum shifted bullish in the mid-session, maximising profits before the afternoon reversal.
🧱 Support & Resistance Levels
Resistance Zones:
25890 (Immediate Major Resistance)
25930 ~ 25920
25985 (Crucial for Bullish Survival)
26030
Support Zones:
25800 (Psychological Base)
25740 ~ 25715 (Last Resort Zone)
🧠 Final Thoughts
“The floor and ceiling are now clearly defined.”
Today’s low of 25,726.30 is now the most important level on the chart. If tomorrow’s session breaches this low, a new downside zone will open up for the Nifty.
Conversely, bulls are in a fight for survival; they need to reclaim and close above 25985 to shift the narrative back to a bullish expansion. Expect a volatile Friday as weekly positions are squared off.
✏️ Disclaimer
This is just my personal viewpoint. Always consult your financial advisor before taking any action.
The Great Tug-of-War: Nifty Ends Flat After 176-Point Intraday Swing.
🗞 Nifty Summary
The Nifty opened with a 52-point Gap Up, which was immediately liquidated within the first candle, leading to a slip toward the 25715 ~ 25740 support zone. After marking an intraday low at 25,726.30, a sharp recovery rally pushed the index north to test the 25840 ~ 25860 resistance.
Bulls showed conviction by breaching this zone and reaching a day high of 25,902.35. However, the 25890 level proved to be a formidable wall, triggering a sharp reversal of over 125 points.
The 25800 psychological level eventually came to the rescue, and a late 50-point recovery allowed the Nifty to close at 25,815.55. The day ended virtually unchanged (-3.00 points, -0.01%), reflecting a fierce battle for territory where neither side could secure a decisive victory.
🛡 5 Min Intraday Chart with Levels
🛡 Intraday Walk
The session was a classic example of “two-way business.” The initial plunge and V-shaped recovery presented excellent opportunities for agile traders.
The most significant technical event was the failure to sustain above 25900, which led to a waterfall sell-off back to the 25800 base. This “round trip” highlights the heavy supply sitting near the 25890 ~ 25920 zone.
While bulls defended the 25700 base early on, their struggle to hold higher ground indicates that the market remains in a cautious consolidation phase.
📉 Daily Time Frame Chart with Intraday Levels
🕯 Daily Candle Breakdown
Open: 25,764.70
High: 25,902.35
Low: 25,726.30
Close: 25,815.55
Change: −3.00 (−0.01%)
🏗️ Structure Breakdown
Type: Small-body indecision candle (Spinning Top).
Range (High–Low): ≈ 176 points — reflecting relatively high intraday volatility.
Body: ≈ 51 points — small real body, indicating a lack of clear directional consensus.
Upper Wick: ≈ 87 points — strong rejection from higher levels (25900 zone).
Lower Wick: ≈ 38 points — buyers modestly defended the downside near the 25725 mark.
📚 Interpretation
The spinning top candle after such wide intraday swings signifies total equilibrium between supply and demand at the current levels. The long upper wick is the dominant feature, showing that sellers are very aggressive near 25900. However, the fact that the close remained above the open and the PDC suggests that bulls are unwilling to give up the 25800 territory just yet.
🕯 Candle Type
Spinning-Top / Indecision Candle — Signals uncertainty; the direction of the next candle will be crucial for confirming a breakout or a further breakdown.
🛡 5 Min Intraday Chart
⚔️ Gladiator Strategy Update
ATR: 191.66
IB Range: 100.85 → Medium
Market Structure: Balanced
Trade Highlights:
10:06 Long Trade - Target Hit (RR 1:3.39) (Contra Trade)
11:21 Long Trade - Target Hit (RR 1:2.28) (IBH Breakout)
Trade Summary: An exceptional day for the strategy. By identifying the early base-building at the 25726 support, the system captured a high R/R contra-long. A successful IBH breakout trade followed this as momentum shifted bullish in the mid-session, maximising profits before the afternoon reversal.
🧱 Support & Resistance Levels
Resistance Zones:
25890 (Immediate Major Resistance)
25930 ~ 25920
25985 (Crucial for Bullish Survival)
26030
Support Zones:
25800 (Psychological Base)
25740 ~ 25715 (Last Resort Zone)
🧠 Final Thoughts
“The floor and ceiling are now clearly defined.”
Today’s low of 25,726.30 is now the most important level on the chart. If tomorrow’s session breaches this low, a new downside zone will open up for the Nifty.
Conversely, bulls are in a fight for survival; they need to reclaim and close above 25985 to shift the narrative back to a bullish expansion. Expect a volatile Friday as weekly positions are squared off.
✏️ Disclaimer
This is just my personal viewpoint. Always consult your financial advisor before taking any action.

Read my blogs here:
substack.com/@kzatakia
Follow me on Telegram:
t.me/swingtraderhub
Follow me on X:
x.com/kzatakia
substack.com/@kzatakia
Follow me on Telegram:
t.me/swingtraderhub
Follow me on X:
x.com/kzatakia
İlgili yayınlar
Feragatname
Bilgiler ve yayınlar, TradingView tarafından sağlanan veya onaylanan finansal, yatırım, alım satım veya diğer türden tavsiye veya öneriler anlamına gelmez ve teşkil etmez. Kullanım Koşulları bölümünde daha fazlasını okuyun.
Read my blogs here:
substack.com/@kzatakia
Follow me on Telegram:
t.me/swingtraderhub
Follow me on X:
x.com/kzatakia
substack.com/@kzatakia
Follow me on Telegram:
t.me/swingtraderhub
Follow me on X:
x.com/kzatakia
İlgili yayınlar
Feragatname
Bilgiler ve yayınlar, TradingView tarafından sağlanan veya onaylanan finansal, yatırım, alım satım veya diğer türden tavsiye veya öneriler anlamına gelmez ve teşkil etmez. Kullanım Koşulları bölümünde daha fazlasını okuyun.