
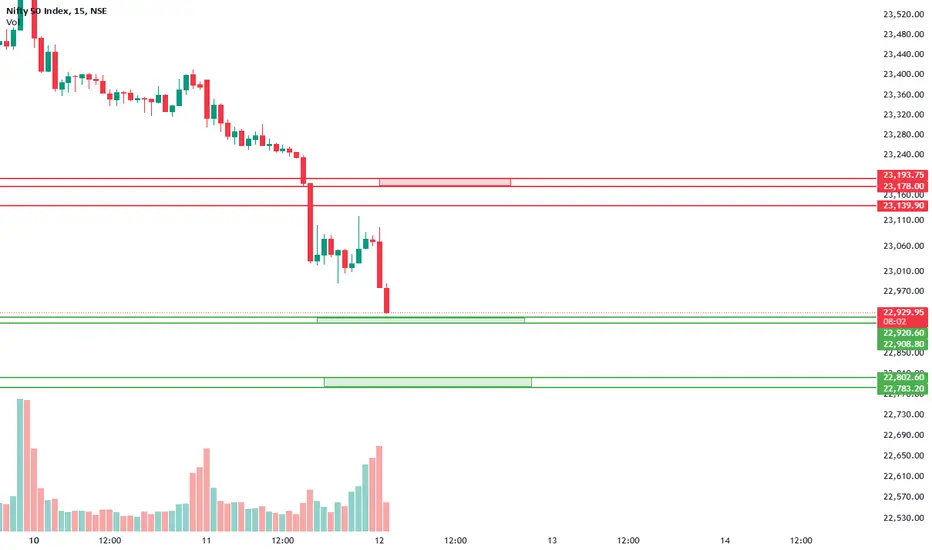
This chart shows support (green levels) and resistance (red levels):
Analysis of the Chart
Resistance Levels (Red)
1 . 23,139.90
2. 23,178.00 - 23,193.75
Support Levels (Green)
The price is currently testing support at around 22,929.95 - 22,920.60.
If this support holds, we may see a bounce back up.
If this level breaks, the price could fall to the next support zone at 22,802.60 - 22,783.20.
Analysis of the Chart
Resistance Levels (Red)
1 . 23,139.90
2. 23,178.00 - 23,193.75
Support Levels (Green)
The price is currently testing support at around 22,929.95 - 22,920.60.
If this support holds, we may see a bounce back up.
If this level breaks, the price could fall to the next support zone at 22,802.60 - 22,783.20.

Feragatname
Bilgiler ve yayınlar, TradingView tarafından sağlanan veya onaylanan finansal, yatırım, alım satım veya diğer türden tavsiye veya öneriler anlamına gelmez ve teşkil etmez. Kullanım Koşulları bölümünde daha fazlasını okuyun.
Feragatname
Bilgiler ve yayınlar, TradingView tarafından sağlanan veya onaylanan finansal, yatırım, alım satım veya diğer türden tavsiye veya öneriler anlamına gelmez ve teşkil etmez. Kullanım Koşulları bölümünde daha fazlasını okuyun.