 NIFTY
Nifty 50 Chart Analysis - Key Insights & Trading Plan
Key Observations:
Support and Resistance Levels:
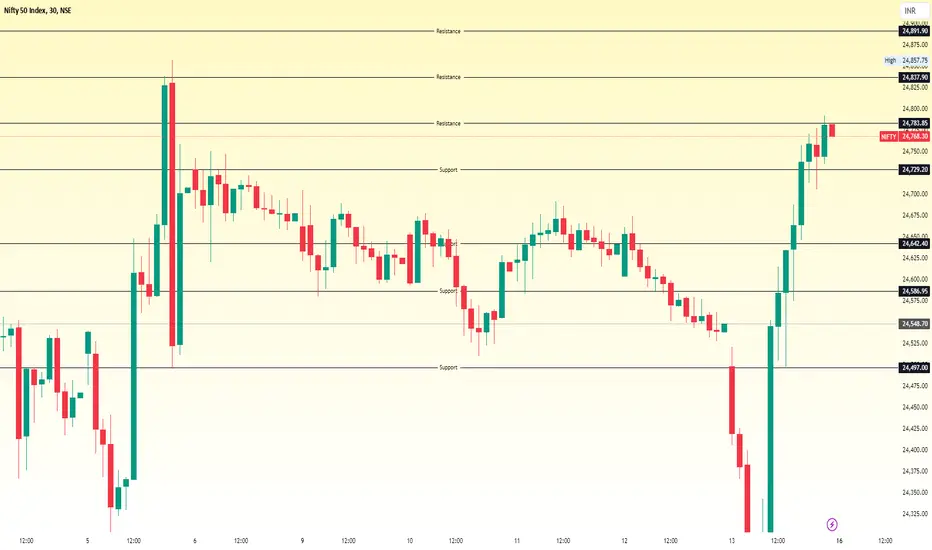
Support: 24,497 | 24,586.95 | 24,662.40
Resistance: 24,783.85 | 24,837.90 | 24,891.90
Price Movement:
The price witnessed a downtrend followed by a strong recovery.
A sharp upward movement has brought the price near 24,783.85, a significant resistance level.
Current Position:
The price is hesitating near the 24,783.85 resistance level, signaling a critical decision point.
Trading Plan:
Bullish Scenario:
Breakout Above 24,783.85:
Target: 24,837.90 → 24,891.90.
Stop-Loss: Below 24,750.
Bearish Scenario:
Rejection at 24,783.85:
Target: Support levels at 24,662.40 → 24,586.95.
Stop-Loss: Above 24,800.
Consolidation Strategy:
Range-Bound Movement between 24,662.40 (support) and 24,783.85 (resistance):
Buy near support,
Sell near resistance.
Summary:
Breakout → Go long (buy).
Rejection → Look for short opportunities.
Watch for volume confirmation during breakouts or rejections to confirm strength.
im not SEBI register.

İlgili yayınlar
Feragatname
Bilgiler ve yayınlar, TradingView tarafından sağlanan veya onaylanan finansal, yatırım, alım satım veya diğer türden tavsiye veya öneriler anlamına gelmez ve teşkil etmez. Kullanım Koşulları bölümünde daha fazlasını okuyun.
İlgili yayınlar
Feragatname
Bilgiler ve yayınlar, TradingView tarafından sağlanan veya onaylanan finansal, yatırım, alım satım veya diğer türden tavsiye veya öneriler anlamına gelmez ve teşkil etmez. Kullanım Koşulları bölümünde daha fazlasını okuyun.