
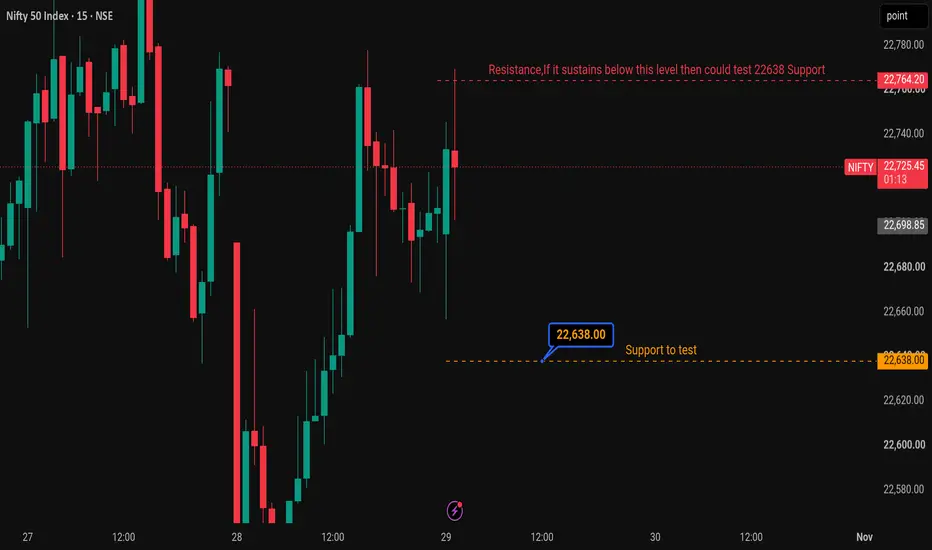
NIFTY 15m: Technical Resistance and Support
Breakdown Plan
• Ticker: NIFTY (Nifty 50 Index) via NSE
• Timeframe: 15-Minute (15m)
• Current Price: 22,759.25 INR (+0.11%)
Key Technical Levels
• Overhead Resistance Target: 22,764.20 INR (Critical structural barrier marked as: "Resistance, if it sustains below this level then could test 22638 Support")
• Defined Support Base: 22,638.00 INR (The key horizontal floor marked by the label: "Support to test")
Market Analysis & Structural Outlook
• Price Action: Following a sharp drop down to structural lows near the 22,580 level, the Nifty 50 Index experienced an aggressive vertical expansion leg upward. The index has now paused and is consolidating immediately beneath its overhead horizontal ceiling.
• Current Framework: The asset is testing the limits of its current trading range. Sellers are actively attempting to cap momentum directly below the 22,764.20 INR resistance line to stall the dynamic breakout attempt.
• Execution Projection: If price action fails to break through and sustain above the 22,764.20 INR overhead barrier, an immediate rotation lower is projected to develop. This rejection shifts structural maps toward a bearish rotation back down to test the major 22,638.00 INR support baseline.
Legal Compliance & Financial Disclaimer
This analysis is published strictly for educational and informational purposes only. It does not constitute financial, investment, trading, or legal advice. Trading index derivatives or underlying contracts carries a high level of risk and may not be suitable for all investors. The high degree of leverage can work against you as well as for you. Before deciding to trade index products, you should carefully consider your investment objectives, level of experience, and risk appetite. Past performance is not indicative of future market results. You should execute your own independent research and consult a certified financial advisor before placing capital at risk in live financial markets. The author assumes no liability for any financial loss incurred directly or indirectly from the use of this information.

Feragatname
Bilgiler ve yayınlar, TradingView tarafından sağlanan veya onaylanan finansal, yatırım, alım satım veya diğer türden tavsiye veya öneriler anlamına gelmez ve teşkil etmez. Kullanım Koşulları bölümünde daha fazlasını okuyun.
Feragatname
Bilgiler ve yayınlar, TradingView tarafından sağlanan veya onaylanan finansal, yatırım, alım satım veya diğer türden tavsiye veya öneriler anlamına gelmez ve teşkil etmez. Kullanım Koşulları bölümünde daha fazlasını okuyun.