
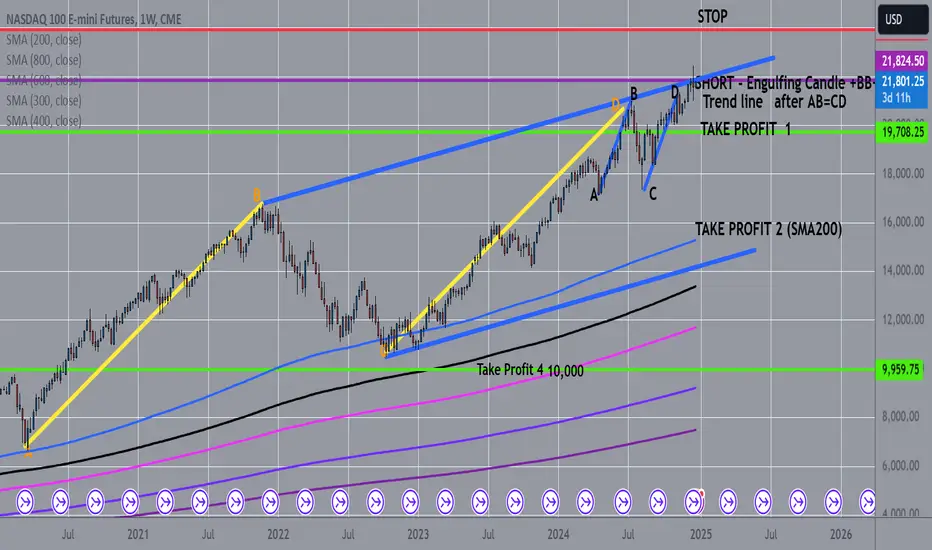
Nasdaq100 Short Weekly Chart, Price after big and small AB=CD + BB+ Trendline+ Engulfing candle at the top, price should go now to Take profit 1 area, and from there if will not be a real support it will go to test the SMA200, for take profit 2 odds are much more small but possible

Feragatname
Bilgiler ve yayınlar, TradingView tarafından sağlanan veya onaylanan finansal, yatırım, alım satım veya diğer türden tavsiye veya öneriler anlamına gelmez ve teşkil etmez. Kullanım Koşulları bölümünde daha fazlasını okuyun.
Feragatname
Bilgiler ve yayınlar, TradingView tarafından sağlanan veya onaylanan finansal, yatırım, alım satım veya diğer türden tavsiye veya öneriler anlamına gelmez ve teşkil etmez. Kullanım Koşulları bölümünde daha fazlasını okuyun.