
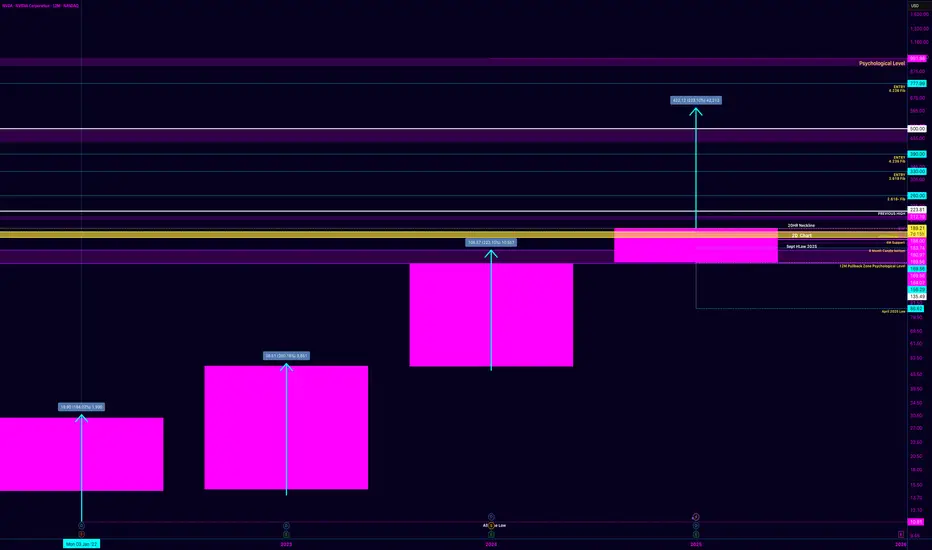
I want to expand on my NVDA thesis by adding one more layer that’s been on my mind — the 223.10% measurement — and how I’m viewing it strictly as a structural possibility, not a prediction.
Everything below is still rooted in market structure and timing.
Quick Recap: Where We Are
Price ran from the $164 region into the $212 highs, then pulled back into the $169–$174 demand zone. That pullback reset momentum and held structure across higher timeframes (2D, 4M, 6M).
From my perspective:
The downside move completed the reset
The market is now compressing
This is pre-breakout behavior, not a failure
The W formation is forming, but not confirmed.
Key Confirmation Still Hasn’t Changed
This remains true regardless of any upside theory:
➡️ Daily close + acceptance above ~$188
Until that happens, price is coiling.
Above that level, the path back to $212 opens structurally.
The 223.10% Theory (How I’m Looking at It)
This part is pure structure math, not expectation.
The previous large expansion candle on the higher timeframe measured approximately 223.10% from its base to its high.
Instead of projecting randomly, I asked a simple question:
What happens if the market repeats the same magnitude of expansion from the current structural base?
So I:
Took the 223.10% expansion
Anchored it to the current price zone (~$189 area)
Projected it upward mechanically
That projection lands in the ~$600–$610 region.
Important clarification:
This is not a forecast
This is not a target
This is a measured possibility, based on prior behavior
Markets don’t repeat perfectly — but they do rhyme, especially on higher timeframes.
Why Timing Makes This Interesting (But Still Uncertain)
The 12-month candle closes in ~7 days.
That matters.
If the market wanted to:
Reclaim $212
Print strength into the yearly close
Signal continuation into the next cycle
This is when it would begin positioning — not after the candle closes.
That said:
Expansion of that magnitude would require momentum confirmation
No confirmation yet = no assumption
Structure comes first. Always.
How I’m Framing This Mentally
I’m not expecting a miracle candle.
I’m not forcing an outcome.
My framework is:
Hold support
Break and accept key levels
Let expansion earn its way higher
If price can’t reclaim $212, the 223.10% theory stays just that — a theory.
But if it does?
Then the market itself opens the conversation.
Final Thought
This thesis isn’t about being right — it’s about being positioned correctly when structure aligns with time.
The homework was done earlier.
Now it’s about watching execution into the close.
Let the market decide.
-MoNi

İlgili yayınlar
Feragatname
Bilgiler ve yayınlar, TradingView tarafından sağlanan veya onaylanan finansal, yatırım, alım satım veya diğer türden tavsiye veya öneriler anlamına gelmez ve teşkil etmez. Kullanım Koşulları bölümünde daha fazlasını okuyun.
İlgili yayınlar
Feragatname
Bilgiler ve yayınlar, TradingView tarafından sağlanan veya onaylanan finansal, yatırım, alım satım veya diğer türden tavsiye veya öneriler anlamına gelmez ve teşkil etmez. Kullanım Koşulları bölümünde daha fazlasını okuyun.