
If you are SHORT, you will enjoy this update. If you are LONG, you can consider the information and maybe use it in your favor.
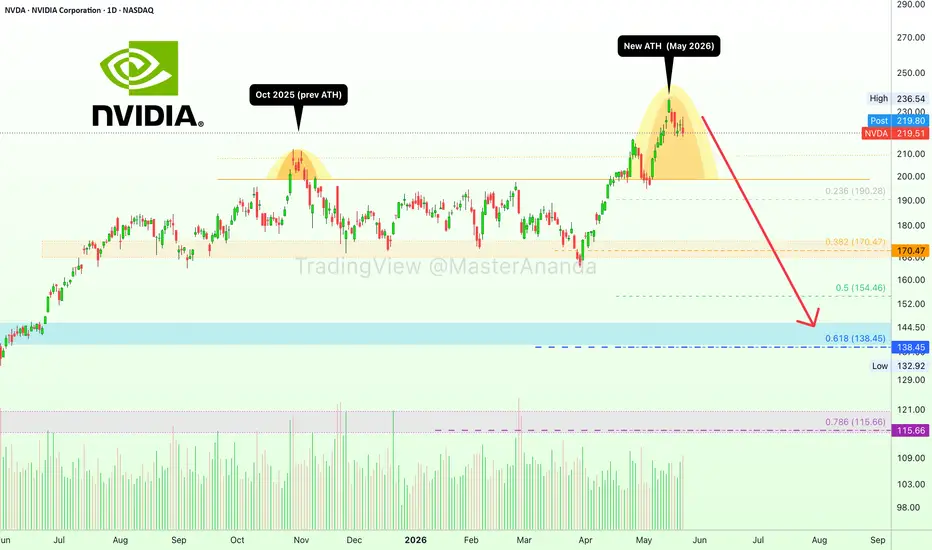
NVIDIA (NVDA). Today's session started green but ended red. This is always pretty bad. This is shown by the upper shadow on the candle. This is an intraday rejection and it is coupled with high volume. The fact that this is happening as a lower high and after a drop is already unraveling makes it more relevant.
All the oscillators continue to point lower in the worst possible way. That is, starting a descent from truly major highs, in some cases, a new all-time high.
The daily RSI peaked 14-May, a week ago. Yesterday it moved up a little and today back down and below a support level, the 0.382 Fib. retracement in orange.
For the MACD I showed you a weak signal in the last update because I didn't have anything better. Most people see it as bullish when it trades high but really, it all depends on the context. Now a strong bearish signal appeared, the bearish cross. This signal can be spotted in two ways. When the MACD line (blue) crosses-down the signal (orange) line; or, when the histogram turns red, it is the same.
After a major high this signal becomes even more pronounced because the MACD has plenty of room to move lower, plenty, which isn't good. I am not a bear nor bearish just sharing what I see, warning you. If you are a bear, double-down. If you are a bull, sell or close the long. This would be the right move based on the data coming from these charts. The decision is yours of course. Think of me as your guardian angel... Just kidding.
Let's continue...
See here the stochastic keeps on moving down and this supports a bearish wave developing on the NVDA stock. This indicator tends to be very accurate if read correctly.
What more can I say? There most be something positive... Oh yes, right!
There is still time. There is time to sell, time to short, time to adapt.
Now, this is just the view of the chart as things are now, it can all change in a matter of days. Naturally, to make a decision many things must be considered, it is not black and white.
We buy at support, when prices are low. If we hold a position from a very low price, it would be easy to take profits. If we just opened a new position at the all-time high, it would be very easy to close it when in doubt, at resistance. If we are just now going short, risk also needs to be considered with a plan, the stop-loss and so on.
My interpretation of the data can be correct but I repeat, market conditions can always change.
NVDA is bearish and the last bullish move doesn't seen to carry much weight. It wasn't part of a rising trend, it looks more like a big bull trap.
Thank you for reading.
Namaste.
NVIDIA (NVDA). Today's session started green but ended red. This is always pretty bad. This is shown by the upper shadow on the candle. This is an intraday rejection and it is coupled with high volume. The fact that this is happening as a lower high and after a drop is already unraveling makes it more relevant.
All the oscillators continue to point lower in the worst possible way. That is, starting a descent from truly major highs, in some cases, a new all-time high.
The daily RSI peaked 14-May, a week ago. Yesterday it moved up a little and today back down and below a support level, the 0.382 Fib. retracement in orange.
For the MACD I showed you a weak signal in the last update because I didn't have anything better. Most people see it as bullish when it trades high but really, it all depends on the context. Now a strong bearish signal appeared, the bearish cross. This signal can be spotted in two ways. When the MACD line (blue) crosses-down the signal (orange) line; or, when the histogram turns red, it is the same.
After a major high this signal becomes even more pronounced because the MACD has plenty of room to move lower, plenty, which isn't good. I am not a bear nor bearish just sharing what I see, warning you. If you are a bear, double-down. If you are a bull, sell or close the long. This would be the right move based on the data coming from these charts. The decision is yours of course. Think of me as your guardian angel... Just kidding.
Let's continue...
See here the stochastic keeps on moving down and this supports a bearish wave developing on the NVDA stock.
What more can I say? There most be something positive... Oh yes, right!
There is still time. There is time to sell, time to short, time to adapt.
Now, this is just the view of the chart as things are now, it can all change in a matter of days. Naturally, to make a decision many things must be considered, it is not black and white.
We buy at support, when prices are low. If we hold a position from a very low price, it would be easy to take profits. If we just opened a new position at the all-time high, it would be very easy to close it when in doubt, at resistance. If we are just now going short, risk also needs to be considered with a plan, the stop-loss and so on.
My interpretation of the data can be correct but I repeat, market conditions can always change.
NVDA is bearish and the last bullish move doesn't seen to carry much weight. It wasn't part of a rising trend, it looks more like a big bull trap.
Thank you for reading.
Namaste.

Trading Cryptocurrencies can be the hardest undertaking ever without the right trade-numbers, without accurate private-access information. Free is free, but the best always requires sweat, an investment. Since 2017 👇
t.me/masteranandatrades/8778
t.me/masteranandatrades/8778
İlgili yayınlar
Feragatname
Bilgiler ve yayınlar, TradingView tarafından sağlanan veya onaylanan finansal, yatırım, alım satım veya diğer türden tavsiye veya öneriler anlamına gelmez ve teşkil etmez. Kullanım Koşulları bölümünde daha fazlasını okuyun.
Trading Cryptocurrencies can be the hardest undertaking ever without the right trade-numbers, without accurate private-access information. Free is free, but the best always requires sweat, an investment. Since 2017 👇
t.me/masteranandatrades/8778
t.me/masteranandatrades/8778
İlgili yayınlar
Feragatname
Bilgiler ve yayınlar, TradingView tarafından sağlanan veya onaylanan finansal, yatırım, alım satım veya diğer türden tavsiye veya öneriler anlamına gelmez ve teşkil etmez. Kullanım Koşulları bölümünde daha fazlasını okuyun.