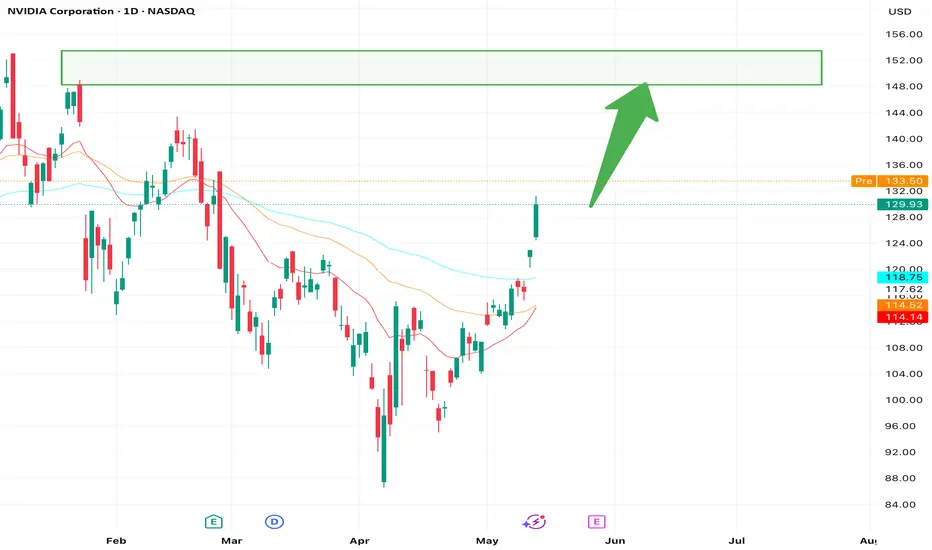
Overview:
 NVDA is showing strong bullish momentum on the 2-hour chart, trading at $132.34 as of the latest candlestick. After a recovery from the March low of $88, the price is now testing a key resistance at $132.47. A breakout above this level could signal a continuation toward higher targets, supported by positive market sentiment and technical indicators.
Key Levels to Watch:
Resistance: $135.47
Next Target: $139.50 (psychological level and prior resistance)
Support: $116.24 (recent low, key support)
Trade Setup:
Direction: Buy on breakout
Entry: $133.50 (confirmation above resistance)
Profit Target: $139.50
Stop Loss: $125.00 (below recent pullback and 50-period MA)
Risk-Reward Ratio: 2:1 (Risk: $2.50, Reward: $5.00)
Follow for the Best Free AI Signals on the market
Ash.
İşlem aktif
Going to TPNot
Now or never, earnings on the edge
Feragatname
Bilgiler ve yayınlar, TradingView tarafından sağlanan veya onaylanan finansal, yatırım, alım satım veya diğer türden tavsiye veya öneriler anlamına gelmez ve teşkil etmez. Kullanım Koşulları bölümünde daha fazlasını okuyun.
Feragatname
Bilgiler ve yayınlar, TradingView tarafından sağlanan veya onaylanan finansal, yatırım, alım satım veya diğer türden tavsiye veya öneriler anlamına gelmez ve teşkil etmez. Kullanım Koşulları bölümünde daha fazlasını okuyun.