
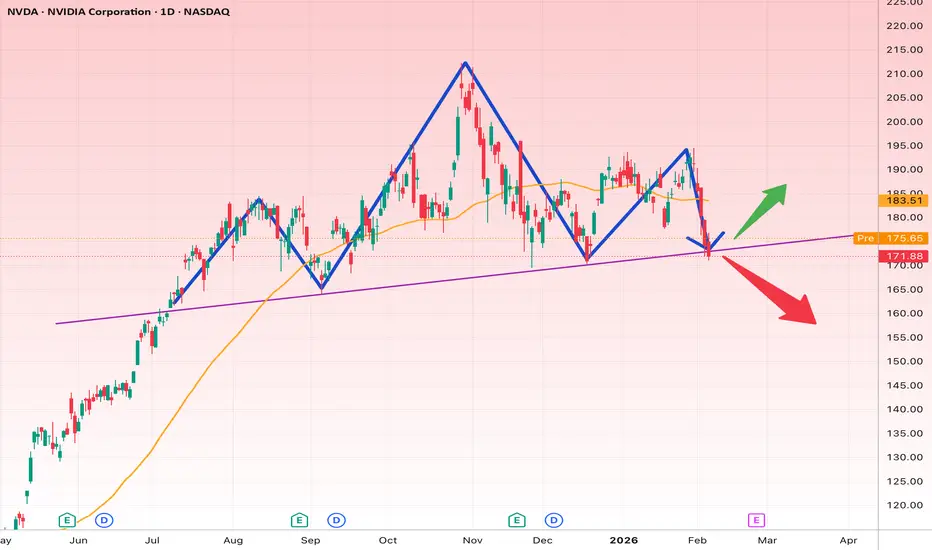
Price is sitting right on a rising trendline support around 172–175, which is a key decision zone.
Bullish scenario:
If this support holds, a rebound toward 183–190 is likely, aligning with prior swing highs and the moving average.
Bearish scenario:
A daily close below ~170 would signal a breakdown, opening downside toward 160–155.
Bias: Neutral → bullish only if trendline support holds.
Invalidation / Stop-loss: Below 170 (daily close).
This is a classic make-or-break level — wait for confirmation before committing.
Bullish scenario:
If this support holds, a rebound toward 183–190 is likely, aligning with prior swing highs and the moving average.
Bearish scenario:
A daily close below ~170 would signal a breakdown, opening downside toward 160–155.
Bias: Neutral → bullish only if trendline support holds.
Invalidation / Stop-loss: Below 170 (daily close).
This is a classic make-or-break level — wait for confirmation before committing.

Feragatname
Bilgiler ve yayınlar, TradingView tarafından sağlanan veya onaylanan finansal, yatırım, alım satım veya diğer türden tavsiye veya öneriler anlamına gelmez ve teşkil etmez. Kullanım Koşulları bölümünde daha fazlasını okuyun.
Feragatname
Bilgiler ve yayınlar, TradingView tarafından sağlanan veya onaylanan finansal, yatırım, alım satım veya diğer türden tavsiye veya öneriler anlamına gelmez ve teşkil etmez. Kullanım Koşulları bölümünde daha fazlasını okuyun.