
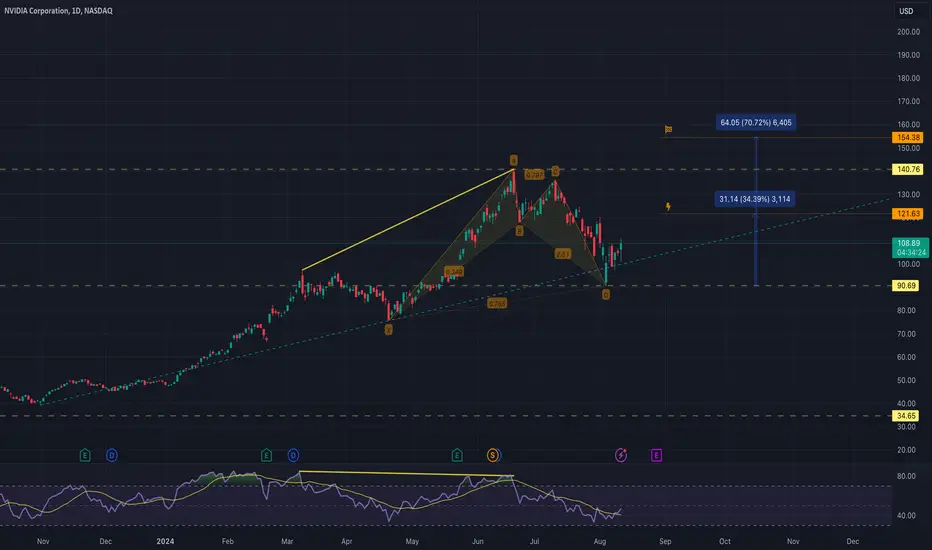
#Nvda 1D chart;
Continues its 8-month steady rise from the beginning of the year to today
It had given the first bearish signal with its divergence in the $140 zone, which is the Ath level.
As of the $90 level, the bullish pattern started and the target points are as in the chart.
Continues its 8-month steady rise from the beginning of the year to today
It had given the first bearish signal with its divergence in the $140 zone, which is the Ath level.
As of the $90 level, the bullish pattern started and the target points are as in the chart.

For more you can follow me on X. @UgurTash
Feragatname
Bilgiler ve yayınlar, TradingView tarafından sağlanan veya onaylanan finansal, yatırım, alım satım veya diğer türden tavsiye veya öneriler anlamına gelmez ve teşkil etmez. Kullanım Koşulları bölümünde daha fazlasını okuyun.
For more you can follow me on X. @UgurTash
Feragatname
Bilgiler ve yayınlar, TradingView tarafından sağlanan veya onaylanan finansal, yatırım, alım satım veya diğer türden tavsiye veya öneriler anlamına gelmez ve teşkil etmez. Kullanım Koşulları bölümünde daha fazlasını okuyun.