

"NZDCAD: the last impulse of the down move?" by ThinkingAntsOk
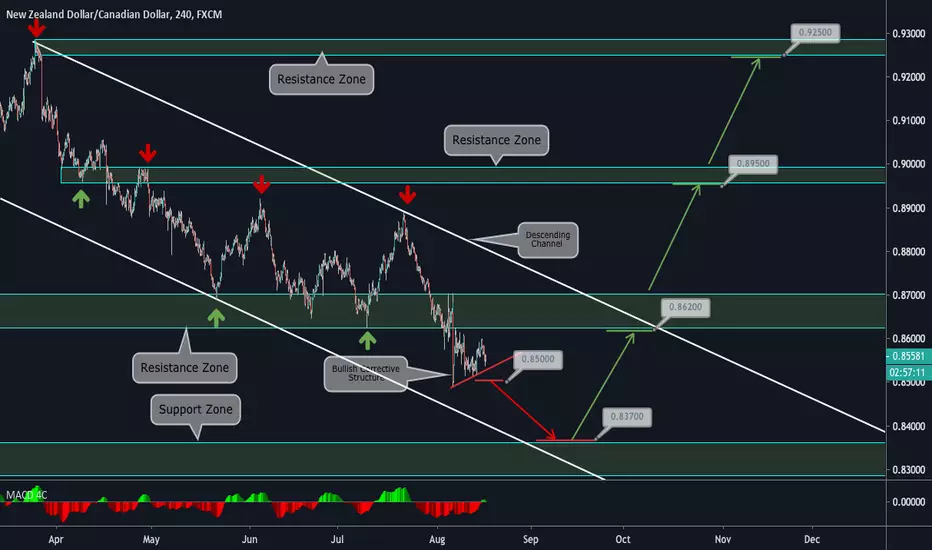
4H CHART EXPLANATION:
- In Weekly Terms, we observe a lateralization in this instrument since 2014.
- In April 19', it started its down move towards the level in which it is now.
- Price is on an a Descending Channel.
- It is currently on a Bearish Corrective Structure. If it breaks it at 0,85, it has potential to move down towards the Support Zone at 0,837.
- After this, we expect price to move up.
Check out our Weekly and Daily Vision, that support our short idea!
Weekly Vision:

Daily Vision:

- In Weekly Terms, we observe a lateralization in this instrument since 2014.
- In April 19', it started its down move towards the level in which it is now.
- Price is on an a Descending Channel.
- It is currently on a Bearish Corrective Structure. If it breaks it at 0,85, it has potential to move down towards the Support Zone at 0,837.
- After this, we expect price to move up.
Check out our Weekly and Daily Vision, that support our short idea!
Weekly Vision:
Daily Vision:

Feragatname
Bilgiler ve yayınlar, TradingView tarafından sağlanan veya onaylanan finansal, yatırım, alım satım veya diğer türden tavsiye veya öneriler anlamına gelmez ve teşkil etmez. Kullanım Koşulları bölümünde daha fazlasını okuyun.
Feragatname
Bilgiler ve yayınlar, TradingView tarafından sağlanan veya onaylanan finansal, yatırım, alım satım veya diğer türden tavsiye veya öneriler anlamına gelmez ve teşkil etmez. Kullanım Koşulları bölümünde daha fazlasını okuyun.