

NZD/CAD:SELL From 61.8% FIBO Resistance AREA DIV RSI SHORT
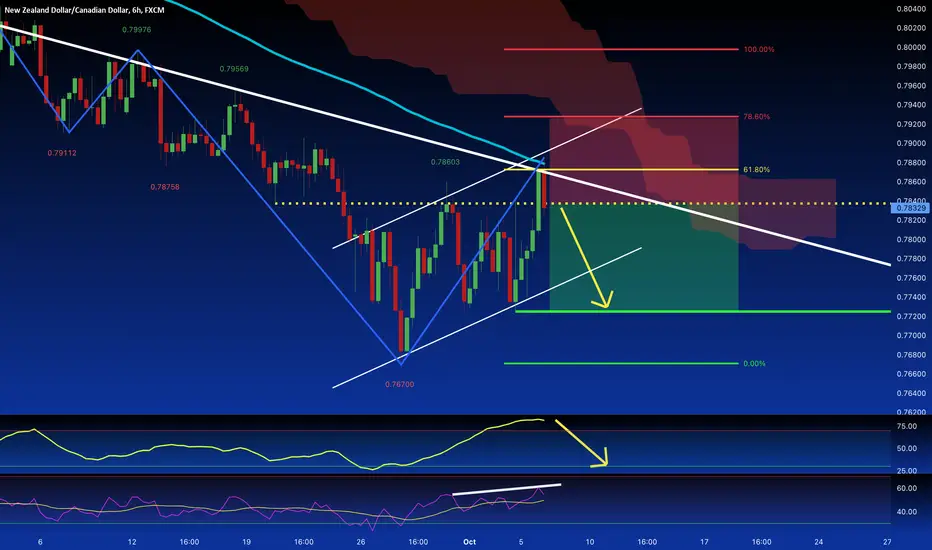
NZD/CAD comes from a solid bearish trend, in the last sessions, the price had a retracement to the 61.8% Fibonacci retracement whereas today the market opened with a strong bearish candle. At this price, the level is placed some static resistance and the dynamic trendline. The 100 Moving average had worked like a rebound point where the candle turned bearish and the indicators, the RSI ( in divergence ), and the Stochastic show a drop-down pattern.
Not

Feragatname
Bilgiler ve yayınlar, TradingView tarafından sağlanan veya onaylanan finansal, yatırım, alım satım veya diğer türden tavsiye veya öneriler anlamına gelmez ve teşkil etmez. Kullanım Koşulları bölümünde daha fazlasını okuyun.
Feragatname
Bilgiler ve yayınlar, TradingView tarafından sağlanan veya onaylanan finansal, yatırım, alım satım veya diğer türden tavsiye veya öneriler anlamına gelmez ve teşkil etmez. Kullanım Koşulları bölümünde daha fazlasını okuyun.