

New Zealand Dollar v US Dollar: MIDAS Technical Analysis
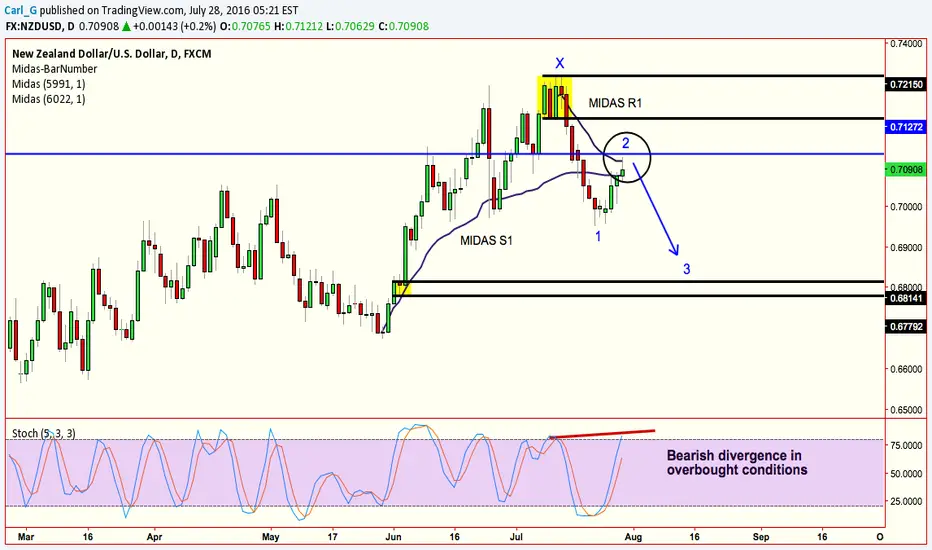
On New Zealand Dollar v US Dollar price have made one leg to the downside (X-1) and have now pulled back to the MIDAS R1 Curve which happens to line up with 4HR Supply and Resistance (Blue Horizontal Line). The MIDAS Support Curve S1 have now become RESISTANCE as price made its first leg to the downside - terminating the uptrend. Momentum is also showing signs of upcoming bearish momentum in form of a bearish divergence in overbought conditions.
MIDAS Trading Tools for MT4 @MQL5.com
MIDAS Trading Tools for MT4 @MQL5.com
İşlem aktif
Entry @ 0.7100Not

İlgili yayınlar
Feragatname
Bilgiler ve yayınlar, TradingView tarafından sağlanan veya onaylanan finansal, yatırım, alım satım veya diğer türden tavsiye veya öneriler anlamına gelmez ve teşkil etmez. Kullanım Koşulları bölümünde daha fazlasını okuyun.
İlgili yayınlar
Feragatname
Bilgiler ve yayınlar, TradingView tarafından sağlanan veya onaylanan finansal, yatırım, alım satım veya diğer türden tavsiye veya öneriler anlamına gelmez ve teşkil etmez. Kullanım Koşulları bölümünde daha fazlasını okuyun.