
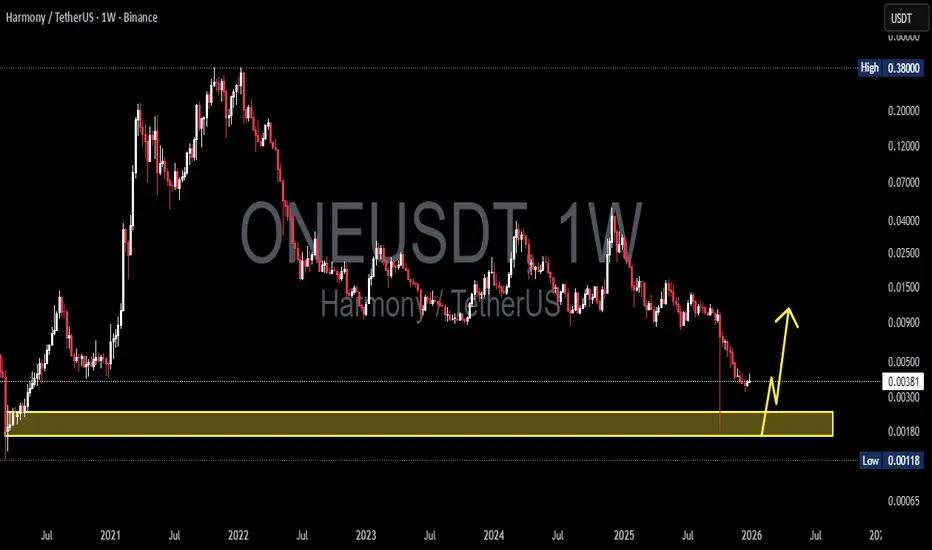
The ONE/USDT on the 1W (Weekly) timeframe shows a clear long-term bearish trend since the all-time high in 2021. Price has consistently formed lower highs and lower lows, confirming strong seller dominance over the past few years.
Currently, price is approaching a major historical demand zone, highlighted by the yellow block between 0.0024 – 0.0017, an area that previously triggered a strong bullish impulse.
---
Pattern & Price Structure
1. Long-Term Downtrend
Market structure remains bearish on a macro scale.
Every upward move has been a relief rally, failing to create a higher high.
2. Descending Structure Breakdown
Price has lost multiple minor supports, indicating progressive weakness.
Strong rejections from the mid-range supply area (around 0.01 – 0.02) accelerated the decline.
3. Major Historical Demand Zone
The 0.0024 – 0.0017 zone represents:
Previous accumulation area
Weekly historical support
Origin of a strong bullish move in the past
Price is now retesting this critical zone.
---
Key Levels
Major Resistance:
0.0050 – 0.0060
0.0090 – 0.0105
Major Support / Demand Zone:
0.0024 – 0.0017
Historical Extreme Low:
0.00118
---
Bullish Scenario
The bullish scenario is only valid if strong buying reactions appear inside the yellow zone:
Formation of:
Long lower wicks on weekly candles
Or a sideways accumulation base
No strong weekly close below 0.0017
Potential upside targets:
Short-term: 0.0050
Mid-term: 0.0090
Maximum relief rally: 0.015 – 0.02
➡️ This scenario represents a speculative bounce, not a confirmed trend reversal.
---
Bearish Scenario
The bearish scenario is confirmed if:
A strong weekly close below 0.0017
Failure of the historical demand zone
Increased selling pressure and breakdown momentum
Consequences:
Price may enter new low price discovery
No clear historical support below this level
High risk of continued downside
➡️ A breakdown here would signal market capitulation.
---
Conclusion
ONE/USDT is currently at a critical make-or-break technical level.
The 0.0024 – 0.0017 zone represents the last major weekly demand zone.
Aggressive buys are suitable only for high-risk traders
Conservative traders should wait for weekly confirmation
As long as price remains below key resistance levels, the primary trend stays bearish
---
#ONEUSDT #HarmonyONE #CryptoAnalysis #WeeklyChart #DemandZone #SupportResistance #BearishTrend #PotentialBounce #AltcoinAnalysis
Currently, price is approaching a major historical demand zone, highlighted by the yellow block between 0.0024 – 0.0017, an area that previously triggered a strong bullish impulse.
---
Pattern & Price Structure
1. Long-Term Downtrend
Market structure remains bearish on a macro scale.
Every upward move has been a relief rally, failing to create a higher high.
2. Descending Structure Breakdown
Price has lost multiple minor supports, indicating progressive weakness.
Strong rejections from the mid-range supply area (around 0.01 – 0.02) accelerated the decline.
3. Major Historical Demand Zone
The 0.0024 – 0.0017 zone represents:
Previous accumulation area
Weekly historical support
Origin of a strong bullish move in the past
Price is now retesting this critical zone.
---
Key Levels
Major Resistance:
0.0050 – 0.0060
0.0090 – 0.0105
Major Support / Demand Zone:
0.0024 – 0.0017
Historical Extreme Low:
0.00118
---
Bullish Scenario
The bullish scenario is only valid if strong buying reactions appear inside the yellow zone:
Formation of:
Long lower wicks on weekly candles
Or a sideways accumulation base
No strong weekly close below 0.0017
Potential upside targets:
Short-term: 0.0050
Mid-term: 0.0090
Maximum relief rally: 0.015 – 0.02
➡️ This scenario represents a speculative bounce, not a confirmed trend reversal.
---
Bearish Scenario
The bearish scenario is confirmed if:
A strong weekly close below 0.0017
Failure of the historical demand zone
Increased selling pressure and breakdown momentum
Consequences:
Price may enter new low price discovery
No clear historical support below this level
High risk of continued downside
➡️ A breakdown here would signal market capitulation.
---
Conclusion
ONE/USDT is currently at a critical make-or-break technical level.
The 0.0024 – 0.0017 zone represents the last major weekly demand zone.
Aggressive buys are suitable only for high-risk traders
Conservative traders should wait for weekly confirmation
As long as price remains below key resistance levels, the primary trend stays bearish
---
#ONEUSDT #HarmonyONE #CryptoAnalysis #WeeklyChart #DemandZone #SupportResistance #BearishTrend #PotentialBounce #AltcoinAnalysis

✅ Get Free Signals! Join Our Telegram Channel Here: t.me/TheCryptoNuclear
✅ Twitter: twitter.com/crypto_nuclear
✅ Join Bybit : partner.bybit.com/b/nuclearvip
✅ Benefits : Lifetime Trading Fee Discount -50%
✅ Twitter: twitter.com/crypto_nuclear
✅ Join Bybit : partner.bybit.com/b/nuclearvip
✅ Benefits : Lifetime Trading Fee Discount -50%
Feragatname
Bilgiler ve yayınlar, TradingView tarafından sağlanan veya onaylanan finansal, yatırım, alım satım veya diğer türden tavsiye veya öneriler anlamına gelmez ve teşkil etmez. Kullanım Koşulları bölümünde daha fazlasını okuyun.
✅ Get Free Signals! Join Our Telegram Channel Here: t.me/TheCryptoNuclear
✅ Twitter: twitter.com/crypto_nuclear
✅ Join Bybit : partner.bybit.com/b/nuclearvip
✅ Benefits : Lifetime Trading Fee Discount -50%
✅ Twitter: twitter.com/crypto_nuclear
✅ Join Bybit : partner.bybit.com/b/nuclearvip
✅ Benefits : Lifetime Trading Fee Discount -50%
Feragatname
Bilgiler ve yayınlar, TradingView tarafından sağlanan veya onaylanan finansal, yatırım, alım satım veya diğer türden tavsiye veya öneriler anlamına gelmez ve teşkil etmez. Kullanım Koşulları bölümünde daha fazlasını okuyun.