
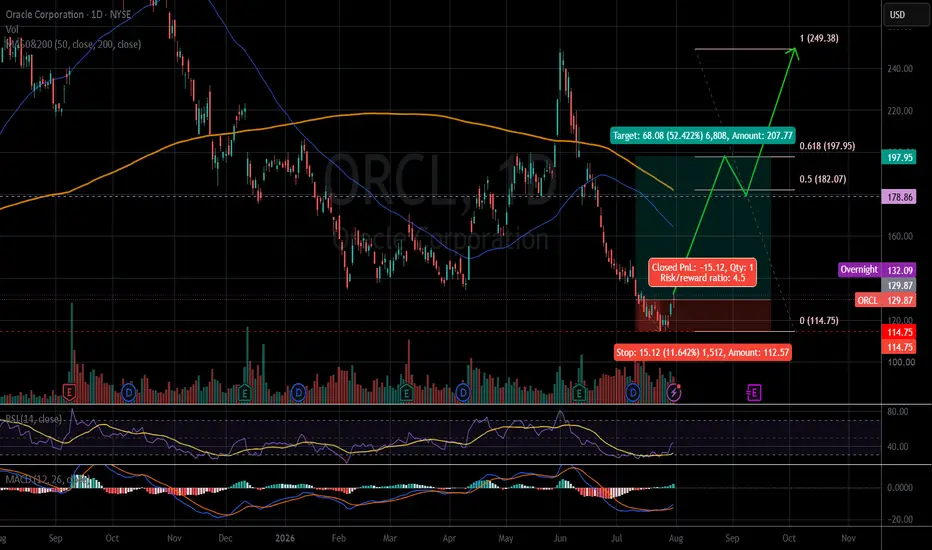
The weekly chart shows a bullish divergence with the RSI.
There were signs of a price increase last week, according to the RSI and MACD indicators.
The price closed on 07.31.2026: $129.87.
Price target: $197.95/ $249.38
Stop loss: $114.75 (-11.6%)
R/R: 4.5
IMO, amateur trader.
Good luck!
There were signs of a price increase last week, according to the RSI and MACD indicators.
The price closed on 07.31.2026: $129.87.
Price target: $197.95/ $249.38
Stop loss: $114.75 (-11.6%)
R/R: 4.5
IMO, amateur trader.
Good luck!

Feragatname
Bilgiler ve yayınlar, TradingView tarafından sağlanan veya onaylanan finansal, yatırım, alım satım veya diğer türden tavsiye veya öneriler anlamına gelmez ve teşkil etmez. Kullanım Koşulları bölümünde daha fazlasını okuyun.
Feragatname
Bilgiler ve yayınlar, TradingView tarafından sağlanan veya onaylanan finansal, yatırım, alım satım veya diğer türden tavsiye veya öneriler anlamına gelmez ve teşkil etmez. Kullanım Koşulları bölümünde daha fazlasını okuyun.