
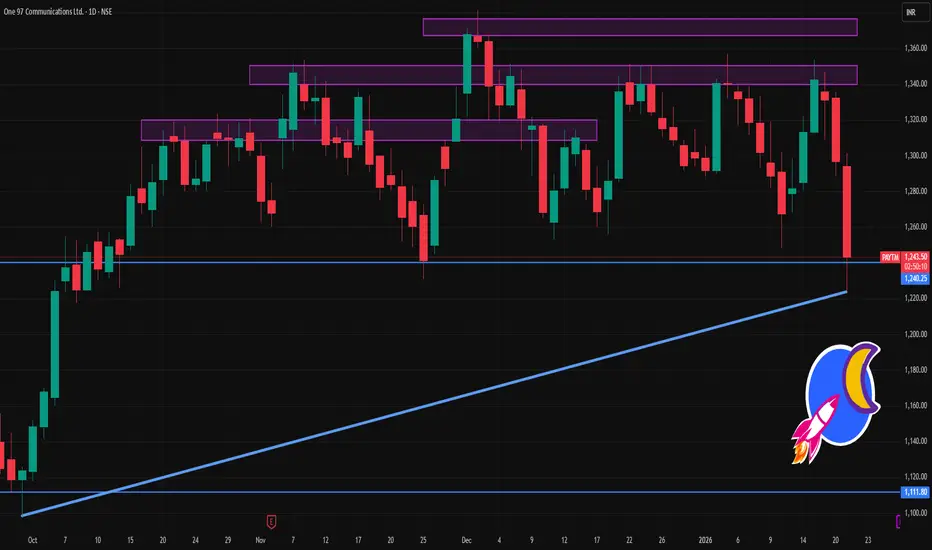
📌 Live/Recent Price:
Around ₹1,240 – ₹1,300 range intra‑day (varying by source/time) — showing recent session weakness.
📊 Daily Pivot & Support/Resistance Levels
These levels are typical pivot analysis (daily frame) used by traders to identify short‑term sell/buy pressure points:
Pivot Zone (Daily): ~₹1,307–1,325
Resistances:
R1: ₹1,325–₹1,330
R2: ₹1,354–₹1,355
R3: ₹1,372–₹1,373
Supports:
S1: ~₹1,278–₹1,280
S2: ~₹1,259–₹1,260
S3: ~₹1,231–₹1,232**
📌 Interpretation:
Above Pivot (₹1,307–₹1,325) ➜ short‑term bullish bias.
Below Pivot ➜ bearish bias with S1→S2 as key downside zones today.
🧠 Key Daily Zones to Watch
🎯 Bullish Break Zones
Strong intraday upside trigger: RSI/Vol can push price back above ₹1,307 pivot
Next upside targets: ₹1,325 → ₹1,354 → ₹1,372
⚠️ Bearish Breakdown Zones
If drops below S1 (~₹1,278), next key downside to watch is ₹1,259 (S2)
Breaking below ₹1,231 (S3) may accelerate intraday selling
Around ₹1,240 – ₹1,300 range intra‑day (varying by source/time) — showing recent session weakness.
📊 Daily Pivot & Support/Resistance Levels
These levels are typical pivot analysis (daily frame) used by traders to identify short‑term sell/buy pressure points:
Pivot Zone (Daily): ~₹1,307–1,325
Resistances:
R1: ₹1,325–₹1,330
R2: ₹1,354–₹1,355
R3: ₹1,372–₹1,373
Supports:
S1: ~₹1,278–₹1,280
S2: ~₹1,259–₹1,260
S3: ~₹1,231–₹1,232**
📌 Interpretation:
Above Pivot (₹1,307–₹1,325) ➜ short‑term bullish bias.
Below Pivot ➜ bearish bias with S1→S2 as key downside zones today.
🧠 Key Daily Zones to Watch
🎯 Bullish Break Zones
Strong intraday upside trigger: RSI/Vol can push price back above ₹1,307 pivot
Next upside targets: ₹1,325 → ₹1,354 → ₹1,372
⚠️ Bearish Breakdown Zones
If drops below S1 (~₹1,278), next key downside to watch is ₹1,259 (S2)
Breaking below ₹1,231 (S3) may accelerate intraday selling

Contact Knowledgehub for a detailed consultation: Dm on WhatsApp: [wa.link/a2o0kz]-
Phone No: [+91 93102 26243]-
Email: [tradingviewknowledgehub@gmail.com]---
-- Let’s achieve success together!
Phone No: [+91 93102 26243]-
Email: [tradingviewknowledgehub@gmail.com]---
-- Let’s achieve success together!
İlgili yayınlar
Feragatname
Bilgiler ve yayınlar, TradingView tarafından sağlanan veya onaylanan finansal, yatırım, alım satım veya diğer türden tavsiye veya öneriler anlamına gelmez ve teşkil etmez. Kullanım Koşulları bölümünde daha fazlasını okuyun.
Contact Knowledgehub for a detailed consultation: Dm on WhatsApp: [wa.link/a2o0kz]-
Phone No: [+91 93102 26243]-
Email: [tradingviewknowledgehub@gmail.com]---
-- Let’s achieve success together!
Phone No: [+91 93102 26243]-
Email: [tradingviewknowledgehub@gmail.com]---
-- Let’s achieve success together!
İlgili yayınlar
Feragatname
Bilgiler ve yayınlar, TradingView tarafından sağlanan veya onaylanan finansal, yatırım, alım satım veya diğer türden tavsiye veya öneriler anlamına gelmez ve teşkil etmez. Kullanım Koşulları bölümünde daha fazlasını okuyun.