
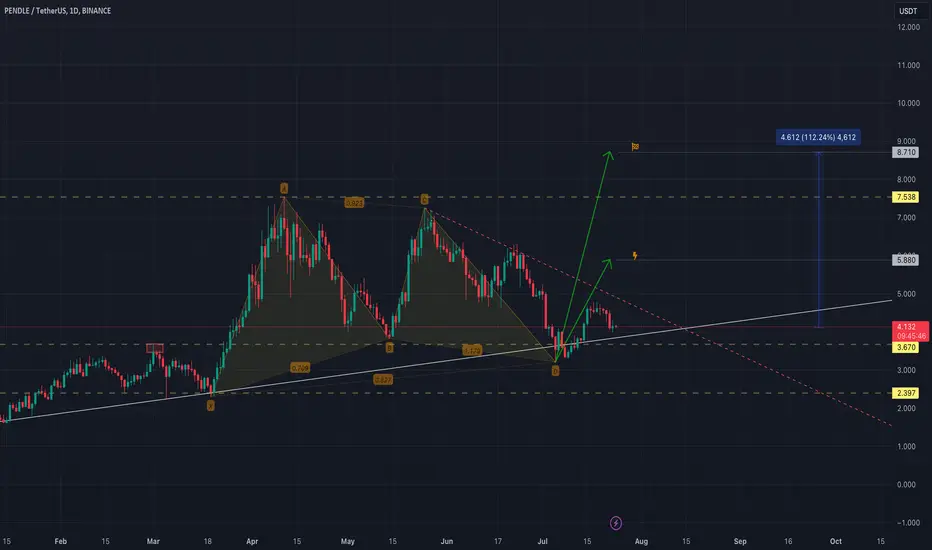
PPENDLE 1D chart;
It accepts the trend line extending from October 2023 to the present as a balance and continues to rise.
We can see an upward movement after the squeeze with the falling trend line.
There is a ratio of 112% between the harmonic structure it has created and the target zone.
It accepts the trend line extending from October 2023 to the present as a balance and continues to rise.
We can see an upward movement after the squeeze with the falling trend line.
There is a ratio of 112% between the harmonic structure it has created and the target zone.

For more you can follow me on X. @UgurTash
Feragatname
Bilgiler ve yayınlar, TradingView tarafından sağlanan veya onaylanan finansal, yatırım, alım satım veya diğer türden tavsiye veya öneriler anlamına gelmez ve teşkil etmez. Kullanım Koşulları bölümünde daha fazlasını okuyun.
For more you can follow me on X. @UgurTash
Feragatname
Bilgiler ve yayınlar, TradingView tarafından sağlanan veya onaylanan finansal, yatırım, alım satım veya diğer türden tavsiye veya öneriler anlamına gelmez ve teşkil etmez. Kullanım Koşulları bölümünde daha fazlasını okuyun.