
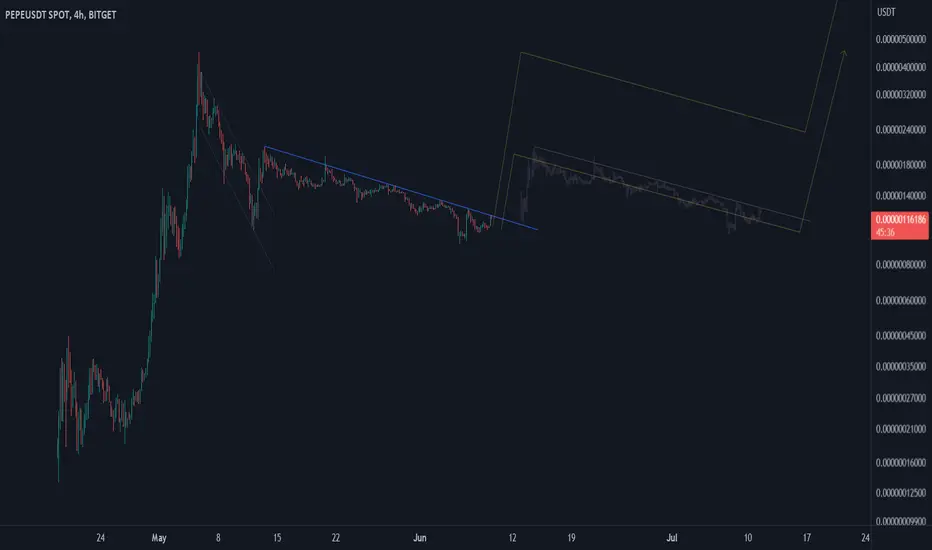
PEPE is a meme coin launched on Ethereum that gained popularity and resulted in high-volume trades. If Pepe maintains this high-volume trade, future growth will happen; most probably. Currently, Pepe is in a downtrend move and has to wait for the price to break the downtrend line. Two possible scenarios are depicted on the chart. Let's see what happens.
P.S. PEPE is a meme coin. So be careful with your trades since sudden popularity and high-volume trades will bring high oscillations.
P.S. PEPE is a meme coin. So be careful with your trades since sudden popularity and high-volume trades will bring high oscillations.
Not
PEPE broke the downtrend line.
Not
So after PEPE broke the downtrend line it went up. Still showing momentum. A flag/triangle pattern formed, and now it seems the price is breaking it.
Not
So it seems PEPE is oscillating in an ascending channel.
Not
After the ascending channel ended, it seems PEPE entered a descending triangle pattern. Let's see what happens.
Not
So, PEPE touched the horizontal support area and then started an upward wave that broke the descending triangle pattern. Now PEPE is approaching the first target/resistance area. Let's see how it will react to this line.
Not
After PEPE reached the first target/resistance area (the horizontal line), it went into a deep corrective phase. Now, it seems PEPE posed for a sharp upward move; if it can break the descending triangle pattern. Let's see what happens.
Not
Nice breakout.
Not
Might start another upward wave. Let's see what happens.
Not
PEPE is approaching the first horizontal resistance area.
Not
Let's see if PEPE can reach the horizontal resistance area.
Not
PEPE finally broke the horizontal resistance area and went up. A pullback is most likely. Let's see how high PEPE can go.
Not
PEPE is moving up, but slowly. There is an ascending resistance line above the PEPE that, if broken, PEPE can start a pump to the next major horizontal resistance area. Let's see what happens.
Not
So, PEPE is going toward the ATH; if PEPE breaks this major horizontal area, further upward movement is possible. Let's see what happens.
Not
So, PEPE broke the ATH and is going up. It seems PEPE has made a Head and Shoulders pattern before its upward phase started. Thus, PEPE can rise to the level equal to the distance between ATH and the Head. Accordingly, there are two possible targets; first is the middle line, and second is the level equal to the whole distance. Let's see what happens.
Not
So, PEPE reached the first target, almost; then went into correction and made a pullback on the broken ATH area. Now it seems PEPE is posed to move toward the next target. Let's see what happens.
Not
So, it seems PEPE is moving in an ascending channel, and just broke the inverted triangular correction pattern. Let's see if PEPE can reach the second target or not.
Not
So, PEPE is still in the correction wave, and it seems a descending channel is unfolding. Let's see what happens.
İşlem aktif
So, PEPE broke the descending channel, made a pullback, and is going up toward the next targets. Let's see what happens.
Not
VIP Telegram channel: t.me/saeedcrypto_public
Feragatname
Bilgiler ve yayınlar, TradingView tarafından sağlanan veya onaylanan finansal, yatırım, alım satım veya diğer türden tavsiye veya öneriler anlamına gelmez ve teşkil etmez. Kullanım Koşulları bölümünde daha fazlasını okuyun.
Feragatname
Bilgiler ve yayınlar, TradingView tarafından sağlanan veya onaylanan finansal, yatırım, alım satım veya diğer türden tavsiye veya öneriler anlamına gelmez ve teşkil etmez. Kullanım Koşulları bölümünde daha fazlasını okuyun.