
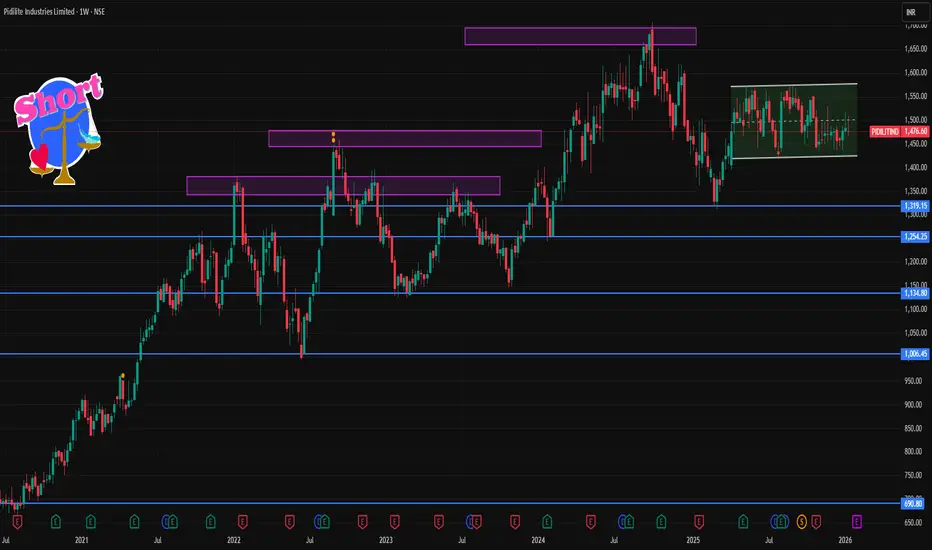
📌 Current Weekly Price Context (as of 16‑17 Jan 2026)
Last seen price: ~₹1,475 on NSE (latest technical snapshot)
Weekly momentum on short/medium averages is neutral (no strong trend bullish or bearish on EMA/SMA clusters)
RSI and other oscillators are also neutral to modestly positive — not extreme.
📈 Weekly Pivot & Key Levels (classic weekly pivot analysis)
Resistance Zones
1. R1: ~₹1,498–₹1,500
2. R2: ~₹1,507–₹1,520
3. R3: ~₹1,520+ (next cluster)
(Weekly pivot resistances based on recent price action)
Pivot Point
Weekly Pivot: ~₹1,484–₹1,486
Above this pivot → slightly bullish bias; below → slightly bearish
Support Zones
1. S1: ~₹1,476–₹1,478
2. S2: ~₹1,462–₹1,470
3. S3: ~₹1,453–₹1,456
(Weekly pivot support levels)
📅 Weekly Levels Summary (Rounded)
Level Price Zone (Approx)
R3 ₹1,520+
R2 ₹1,507–₹1,520
R1 ₹1,498–₹1,500
Pivot ₹1,484–₹1,486
S1 ₹1,476–₹1,478
S2 ₹1,462–₹1,470
S3 ₹1,453–₹1,456

Contact Knowledgehub for a detailed consultation: Dm on WhatsApp: [wa.link/a2o0kz]-
Phone No: [+91 93102 26243]-
Email: [tradingviewknowledgehub@gmail.com]---
-- Let’s achieve success together!
Phone No: [+91 93102 26243]-
Email: [tradingviewknowledgehub@gmail.com]---
-- Let’s achieve success together!
İlgili yayınlar
Feragatname
Bilgiler ve yayınlar, TradingView tarafından sağlanan veya onaylanan finansal, yatırım, alım satım veya diğer türden tavsiye veya öneriler anlamına gelmez ve teşkil etmez. Kullanım Koşulları bölümünde daha fazlasını okuyun.